
Consumer Staples Stocks Have Broken Key Support – Here’s What You Need To Know
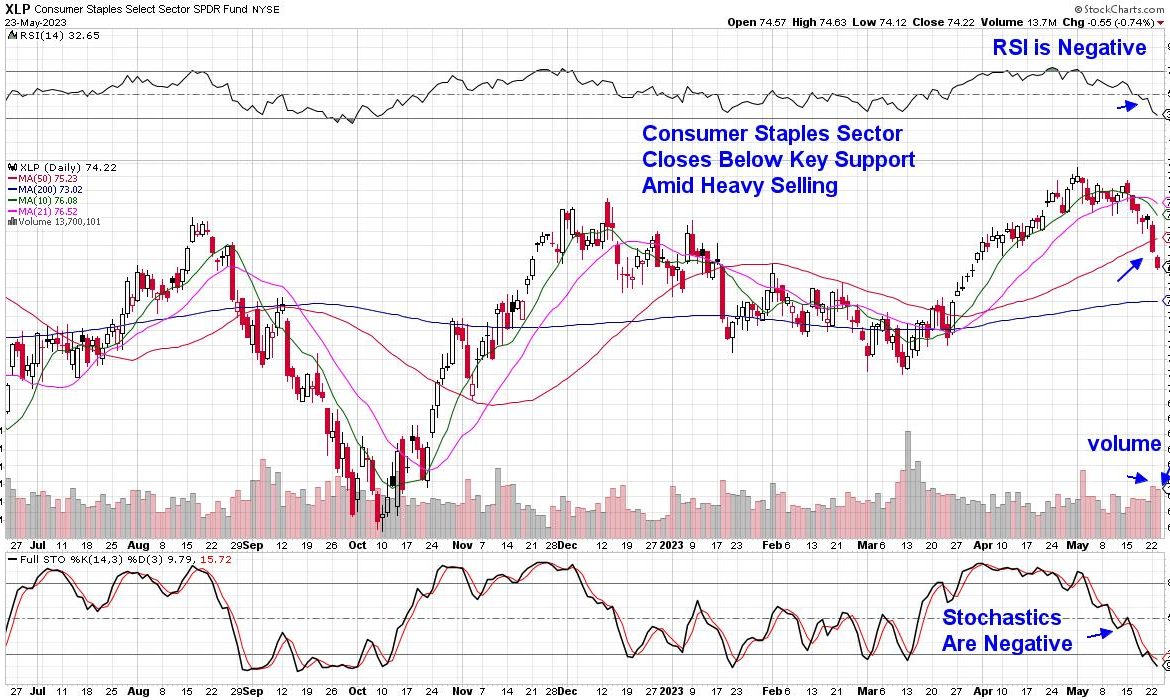
The Consumer Staples sector closed below its key 50-day moving average yesterday and is on track to be the worst performing area for the week. This underperformance began last week and it took place along with other defensive areas of the market such as Utilities and Healthcare. At first glance, it appeared as if last week’s 4% gain in Technology was being funded by the sale of these safe haven stocks.
DAILY CHART OF CONSUMER STAPLES SECTOR
This week’s selling tells a different story however, as Tech stocks have pulled back more than the markets while Utilities and Healthcare are faring better – but not Staples.
One differentiator this week is that well-known Retailers are reporting earnings and the outlook is not particularly good. Today, BJ’s Wholesale (BJ -7.3%) reported earnings that were below estimates with management guiding growth lower into the remainder of this year. The big box retailer of staples and other goods stated that the company is dealing with an “increasingly discerning consumer environment”.
In other words, customers are more conscious as they continue to try and stretch their dollar. The CEO of BJ’s stated that “Everyone wants to save money. Everybody feels like it’s a bumpy economy out there.” It was a theme of “trading down” that also dominated big box earnings reports from last week as well.
Before this week’s pullback,, the biggest winners among Staples have been those companies that have been able to raise their prices while brand loyalty among customers has kept sales levels high. This would include Hershey’s (HSY), Pepsi (PEP) and Kimberly-Clark (KMB) to name a few. The buy at all costs mentality that drove these stocks to new heights appears to be shifting however, as a more price conscious consumer is now buying goods.
TWO-WEEK DAILY CHARTS OF KMB,HSY,PEP
At this time, Hersey (HSY), Pepsi (PEP) and Kimberly Clark (KMB) remain above their key 50-day moving averages and the recent pullback may have been enough to bring these stocks into a more favorable price to earnings (P/E) ratio. Keep your eye on the daily charts for signals – and any rally on volume that pushes the RSI back into positive territory on their daily charts would be a “buy” signal. A close below their 50-day moving average however, would be a signal to lighten up on any shares.
Warmly,
Mary Ellen McGonagle, MEM Investment Research
*This article was first published in the Five Star Newsletter that’s produced by Simpler Trading.
Those who would like to trial my bi-weekly MEM Edge Report can use this link here! We’re all about capturing sector rotation and getting investors into the best stocks to capitalize on that new move.