
Week Ahead: NIFTY to Face Monthly Derivatives Expiry Resisting Key Levels; Moving Past This Zone Crucial
After rising three weeks in a row, the Indian equities took a breather, ending the week on a negative note much on the anticipated lines while resisting the key levels. There has been a slight divergence between the Indian markets and the global markets. Structurally speaking, SPX and other key European Indices like DAX look stronger than NIFTY; however, it can be said that they are perhaps playing a catchup of their relative underperformance over the past months. The trading range got wider as NIFTY oscillated in a 398-points range over the past five sessions. While continuing to resist the key levels, the headline index closed with a net loss of 111.40 points (-0.61%) on a weekly basis.
VIX, too, saw a decline. While remainin at relatively one of its lowest levels, INDIAVIX declined by 4.28% to 12.30. We enter the expiry week of the current month’s derivative series and the markets are set to stay influenced by the expiry and rollover-centric activities. While not comparing the NIFTY chart with global indices charts and looking at them in isolation, it appears that some negative divergence in performance may stay for some more time. The derivative data shows NIFTY facing stiff resistance in the 18350-18500 zone; unless this zone is taken out meaningfully, no runaway rally can be expected in the markets.
In his speech yesterday where he was interviewed by a top US Central Bank staffer, the Fed chief Jerome Powell made highly scripted and unclear remarks, saying it is unclear if U.S. interest rates will need to rise further. He further said that the central bank would now make decisions “meeting-by-meeting,” further adding that, after a year of aggressive rate increases, they can afford to look at the data and evolving outlook to make careful assessments.
Monday is again expected to see a quiet start; NIFTY is likely to find resistance at 18350 and 18480 levels. The supports will come in at 18040 and 17800 levels. The trading range will stay wider than usual.
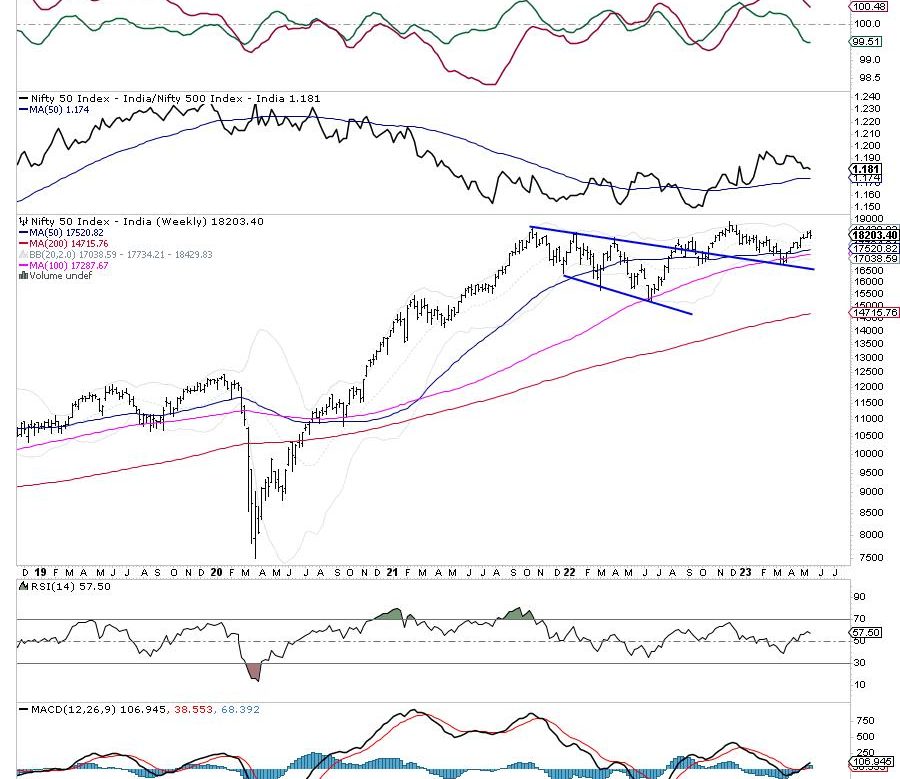
The weekly RSI is 57.50; it remains below 60 and neutral without showing any divergence against the price. The weekly MACD is bullish and trades above the signal line. No notable formations were seen on the candles.
The pattern analysis shows that the NIFTY is playing out well to the falling trend line that begins from 18600 and joins the subsequent lower tops. The index resisted this trendline multiple times before crossing above it and taking support on it twice. Right now, the index trades near another pattern resistance point of 18389; this makes the 18350-18500 zone a strong resistance zone for the index.
All in all, we are not yet completely out of the woods; the technical structure of the markets suggests that the ranged consolidation may continue and the markets will continue finding selling pressure at higher levels. There is no technical evidence present on the chart that suggests a steep decline; however, there won’t be any steep up-move in the markets either unless the 18350-18500 zone is taken out convincingly. It is strongly recommended to continue approaching the markets on a highly selective basis and vigilantly protect profits at higher levels.
Sector Analysis for the Coming Week
In our look at Relative Rotation Graphs®, we compared various sectors against CNX500 (NIFTY 500 Index), which represents over 95% of the free float market cap of all the stocks listed.
The analysis of Relative Rotation Graphs (RRG) shows NIFTY Realty, BankNifty, Consumption, and Financial Services indices are inside the leading quadrant. These groups are likely to show relative outperformance against the broader NIFTY 500 Index. The FMCG, Midcap 100, and Infrastructure indices are also inside the leading quadrant. Some relative outperformance can be expected from these groups as well, but they appear to be giving up on their relative momentum.
NIFTY PSE Index has rolled inside the weakening quadrant. The Auto index also remains in the weakening quadrant, but shows some improvement in its relative momentum.
The Nifty PSU Bank index has rolled inside the lagging quadrant. The IT Index is also seen languishing inside the lagging quadrant. The Media, Commodities, and Metal indices are also seen placed inside the lagging quadrant.
The Energy and the Pharma Indices are inside the improving quadrant.
Important Note: RRG™ charts show the relative strength and momentum of a group of stocks. In the above chart, they show relative performance against NIFTY 500 Index (Broader Markets) and should not be used directly as buy or sell signals.
Milan Vaishnav, CMT, MSTA
Consulting Technical Analyst