
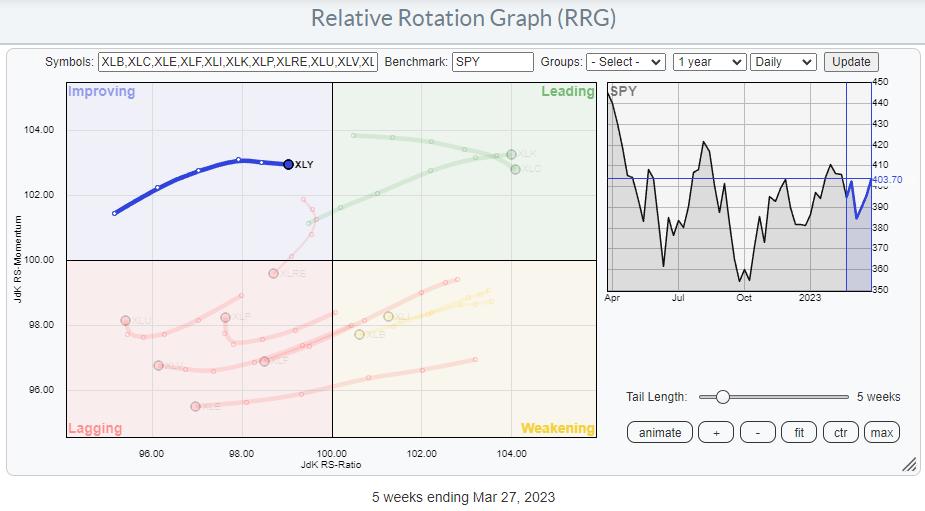
On the weekly RRG, the tail for XLY, Consumer Discretionary, is inside the improving quadrant and heading at an RRG-Heading of roughly 90 degrees. Not ideal; Somewhere between 0-90 is stronger as it indicates that the trend is still picking up speed, but not wrong either.
With only two sectors inside the leading quadrant, XLK and XLC, it makes sense to see if we can identify the next leading sector. Consumer Discretionary seems to be a good candidate.
Drilling into individual stocks
When we dive into the members of the Consumer Discretionary sector and use XLY as the benchmark, an interesting image shows up. Not one of these individual stocks is positioned inside the leading quadrant. This is because of the strong rotation of TSLA recently, which is pushing all other stocks in the opposite direction.
This distortion can be avoided by switching to RCD, the equal-weight sector ETF for the Discretionary sector.
On this RRG, you can see a much more evenly spread universe. I have zoomed in to visualize better the rotations which push TSLA off the grid, but we know where it is.
Looking at this image, quite rapidly, a few exciting tails can be identified. These are highlighted in the RRG below.
Inside LEADING: MGM, LEN, NVR, ULTA, TSCO
Inside IMPROVING: TSLA, AMZN, F, CMG, GM, HLT, MAR
Inside LAGGING: MCD, ORLY, DRI
Going over the charts of these companies, these three popped up as particularly interesting.
ULTA – ULTA BEauty Inc.
After breaking out of its range towards the end of 2022, ULTA started moving in a nice rising channel and this week managed to take out its previous high. This confirms the strength of the underlying trend, as it is visible in the series of higher highs and higher lows.
The recent break of resistance is a move into uncharted territory, opening up much more upside potential for ULTA. At the same time, the downside is well protected by the previous resistance level around 530 and the rising support line that marks the channel’s lower boundary slightly below that 530 area.
The RS line and the RRG-Lines in the chart above use RCD as the benchmark, just like on the RRG. The stable relative uptrend and the recent turn back up in both the JdK RS-Ratio and RS-Momentum lines suggest a new up-leg in this relative trend is underway.
AMZN – Amazon.com
THE biggest stock inside the Consumer Discretionary sector is Amazon at almost 25%. So it is safe to say that “When Amazon moves, the sector moves.”
Looking at the chart above, we can see how Amazon literally halved in price from 180 back in November 2021 to 80 at the end of 2022. The raw relative strength for AMZN against RCD has already started moving in a downtrend since the start of 2021.
This resulted in the RS-Ratio line remaining below 100 for over two years. The price decline seems to have halted after the low set in December, and improvements are starting to become visible from that trough.
A first higher low is now in place around 90, and the chart is now pushing for a break above double resistance offered by the horizontal level that lines up multiple highs and lows going back as far as 2018 and the falling resistance line that runs over the price peaks since late 2021.
A break above 103-105 will be a significant signal, confirming that the downtrend has ended and signaling the start of a new uptrend. It will undoubtedly help the raw RS-Line to turn around and get back into its, still, slightly falling channel and move to the upper boundary of that channel.
When Amazon turns around, that will very likely also be a driver for the further movement of the S&P 500.
MCD – McDonald’s Corp
The third chart is for MCD. Although the tail is still inside the lagging quadrant, it has made a nice turn back up and into an RRG-Heading between 0-90 degrees.
These rotations into a strong RRG-heading are always a sign of strength, regardless of which quadrant they occur. But what makes this one extra interesting is the break of price to new highs, new All-Time-Highs, into uncharted territory.
In October 2022, MCD pushed above horizontal resistance around 260, but shortly after that break started to move in a slightly down-sloping range while using 260, the former breakout level, as support.
These weeks’ jump above the upper boundary of that consolidation and above the previous highs at 278 is signaling a new phase in this uptrend. There is no overhead resistance anymore, and the downside is protected around the 270 area, where the former upper boundary of the trading range can now be expected to offer support.
Overall, it is interesting to see that the Consumer Discretionary sector is showing a mix of stocks that are either, very close to, breaking to new all-time highs or close to completing very large basing patterns after prolonged downtrends. Both are strong contributors to overall stock market health when they materialize.
#StayAlert and have a great weekend, –Julius