This week, stocks started in a position of strength and ended in a position of weakness. While some groups, like semiconductors, have managed to remain strong, the major benchmarks managing to pound out a positive return for the week, the broad market message appears cautious-at-best by my read.
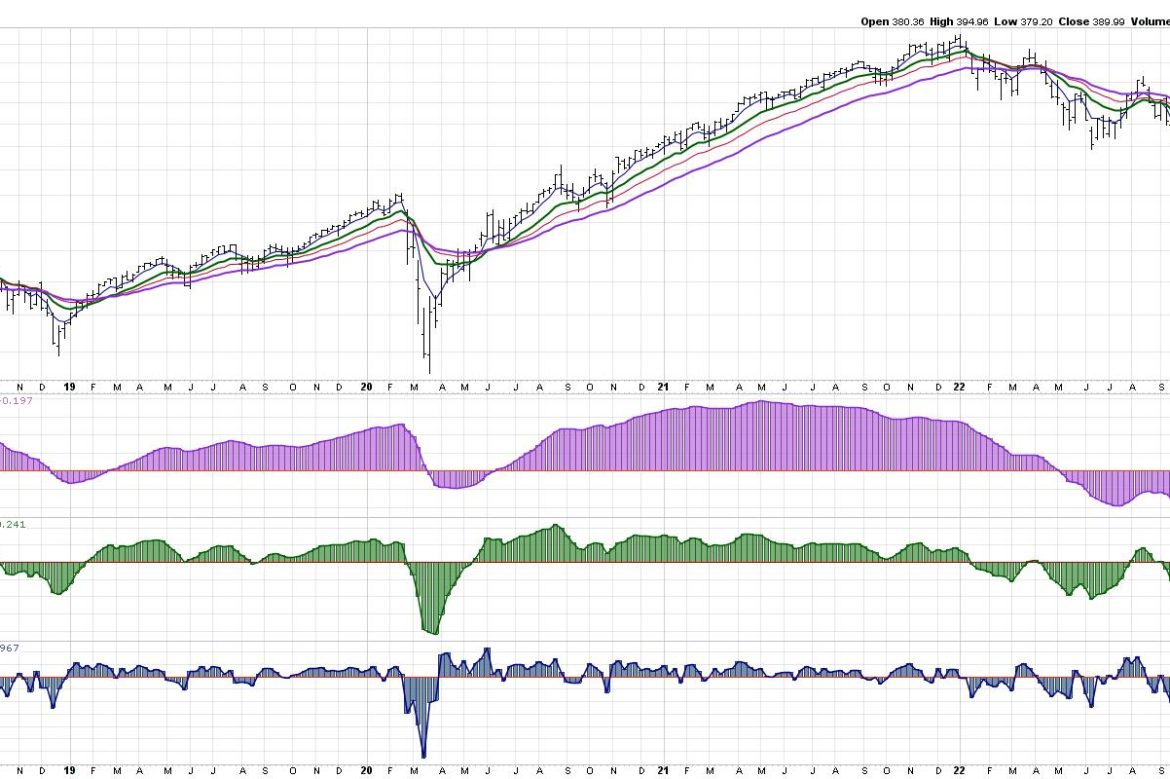
My main Market Trend Model is based on weekly exponential moving averages and helps me gauge the market trend on three time frames on the same chart. On Friday’s close, the medium-term model turned slightly negative, which means the model is now bearish on all three time frames.
This has only happened 11 other times since the tech bubble in 2000, and represents a confirmed distribution pattern for equities. Meaning it’s either a raging buy signal (if you think we’re in a secular bull market) or a serious sell signal (if you believe we’re now in a secular bear).
Allow me to explain.
Building a Market Trend Model
Years ago, I was trying to create a systematic model to mirror the subjective analysis I was doing every week. I’d always look at a weekly chart of the S&P 500 and ask, “What is the short-term, medium-term, and long-term trend?”
After lots of trial and error, I ended with something similar to the current setup using three sets of weekly exponential moving averages. Why did I choose exponential instead of simple moving averages? I’ll get to that below!
This chart will be one of many we’ll discuss in our upcoming FREE webcast, Charting a Financial Crisis. Join me on Tuesday, March 21 at 1:00pm ET for a visual review of the evidence and where opportunities can emerge in a period of great uncertainty. Sign up HERE for this free event!
For my model, I use the PPO indicator to show these three moving average combinations. If the indicator is above zero, it’s bullish. Below zero, and it’s bearish. Simple.
The long-term model turned negative in May 2022 after being confirmed bullish since June 2020. The medium-term model was briefly bullish in March and August of last year, then switched to a more consistent bullish reading in November. The short-term model has been volatile, switching often between bullish and bearish settings.
I should note that the medium-term model is my main risk on/off gauge. When its reading is bullish, that suggests a risk-on positioning and that I should be actively looking for new long ideas. When the model is bearish, that tells me to go more risk-off; in other words, I should focus more on capital preservation than capital growth.
So what does it mean that the model is now bearish on all three time frames? Now we need to bring in more history.
Counting the Bearish Trifectas
Let’s go back to the market top in 2000 and see how often this “bearish trifecta” has occurred.
We’ve had this “triple bearish” reading now 12 times since 2000. Only three of those happened before the 2009 market low, and the other nine came after. Four of the signals have triggered since the 2022 market peak.
What does this mean? Well, the left half of the chart shows the secular bear market that I would loosely define as 2000-2013. The first three signals occurred after the long-term model was bullish for years, and the rotation to a negative LT trend was an unusual event. Selloffs in 2001-03 and 2008-09 happened really accelerated after this bearish pattern.
After the 2009 low, this bearish trifecta could almost be considered a contrarian bullish signal, similar to a stock pulling back to an ascending 50-day moving average or the RSI dropping down to 40 during an uptrend. The bearish trifecta signals pretty much line up with every major bottom since 2009. So where does that leave us today?
Don’t Fight the Fed
Here’s where the macroeconomic argument comes in. If you believe that the market drop since the end of 2021 represents a major change of character for stocks, and that the Fed’s tightening cycle represents an end to the “easy money” era of the 2010s, then this could be just the beginning.
I would have discounted the likelihood of this scenario in a big way up until about a week ago. But with the latest financial crisis potentially still in its early stages, a larger waterfall decline from current levels now seems like a scenario we should all be considering.
On the other hand, if you think of 2022 as another buyable long-term dip along the lines of 2018 and 2016, and you assume that the Fed will reverse course quickly to alleviate further market downside (and you assume that it will work!), then perhaps this is yet another buy signal in the great secular bull market.
In either case, I’ve learned not to get too married to a narrative, and to consider all the potential outcomes. That has helped me to be better prepared for whatever comes next. And in this environment, it will definitely pay to be prepared!
By the way, interested in learning more about why I used exponential instead of simple moving averages for my Market Trend Model? Head over to my YouTube channel.
RR#6,
Dave
P.S. Ready to upgrade your investment process? Check out my free behavioral investing course!
David Keller, CMT
Chief Market Strategist
StockCharts.com
Disclaimer: This blog is for educational purposes only and should not be construed as financial advice. The ideas and strategies should never be used without first assessing your own personal and financial situation, or without consulting a financial professional.
The author does not have a position in mentioned securities at the time of publication. Any opinions expressed herein are solely those of the author and do not in any way represent the views or opinions of any other person or entity.

