Two big things about Campbell Soup (CPB)
First, the company crushed it in earnings last Wednesday. Its second-quarter FY23 results delivered an upside surprise with an EPS that was 8.37% higher than analysts expected and revenue 2.21% higher than Wall Street estimates.Second, CPB is rising from the bottom side of a wide and long trend channel.
What drove the earnings beat? The company said that its strong brand, pricing advantage, increased productivity, and supply chain improvements helped crank up efficiency and, eventually, profits. For the coming quarter, Campbell expects an 8.5–10% increase in sales growth.
Consumer Staples may not be the sexiest thing on Wall Street, but this 154-year-old company has been delivering strong fundamental value to investors (and chicken soup among other foods for every occasion, good and bad) on a consistent basis. Plus, with the economy situated between runaway inflation and a potential recession, the Consumer Staples sector is like Wall Street’s proverbial chicken soup.
Not-So-Attractive Up Close, Better From a Distance
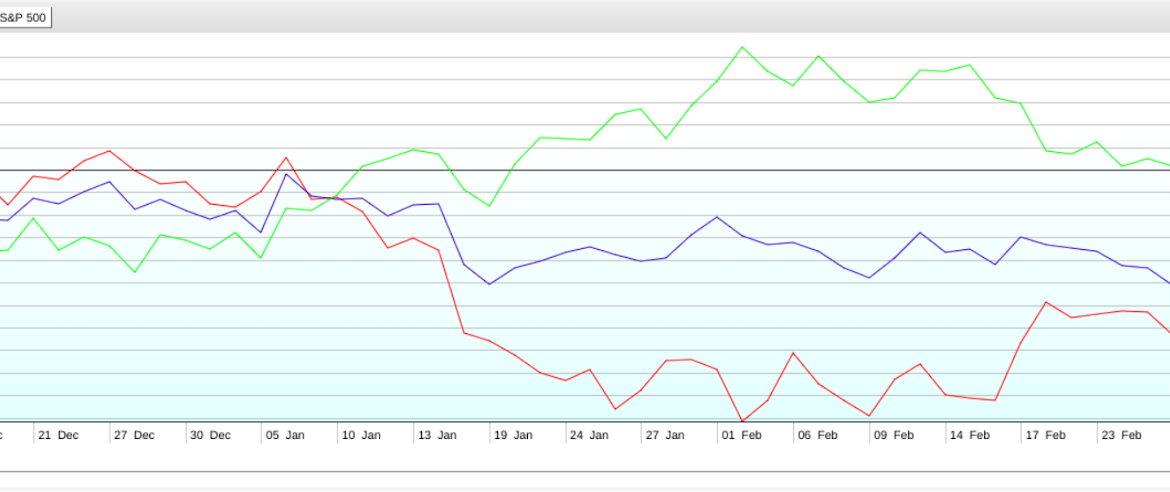
If you take a look at Campbell’s three-month performance relative to the Consumer Staples sector using XLP as a proxy and the S&P 500 on PerfCharts, it’s clearly an underperformer.
Backup a year, and it far outperforms both.
A quick StockCharts Symbol Summary check shows that Campbell’s three-month SCTR reading is in the 70s, which is well above XLP’s at around 40. Also note that CPB pays dividends to its shareholders.
And if you look at a chart going back a year…
CHART 1: DAILY CHART OF CAMPBELL SOUP CO. (CPB). The stock has been rising forming a trend channel, which can act as support and resistance levels for entering and exiting trades. Note: Click on chart above for live version.Chart source: StockCharts.com. For illustrative purposes only.
You can see that Campbell’s has been steadily riding the 200-day moving average (MA) and is currently rising from the bottom of a trend channel.
What about trend channels? If you’re unfamiliar with them, trend channels are created by drawing two parallel lines connecting highs and lows. They can be used to identify the direction and strength of a price trend. But traders often look to them as areas of potential support and resistance as well as potential entry and exit levels.
A bullish bias… Given the company’s fundamentals, the market’s broader sentiment toward current economic uncertainties which leans bearish, and the current momentum (note the RSI’s position halfway between the 30 and the 70), CPB looks like it might be well positioned for a bullish move, but will it have enough momentum to hit the top part of the channel?
Support below the 50 price level is underscored by the amount of Volume by Price—that range marking the second longest bar—and revealing how demand pressure exceeded selling pressure.
Strong resistance is expected at 57.50–57.65 coinciding with a 2020 (not illustrated above) and 2023 highs. The trend channel top is looking to exceed these levels, and should the stock break above both, it’s looking at a six-year high (not seen since May 2017). And as far as stop losses are concerned, a few cents below the upper channel might be favorable.
Now, if you’re able to enter a position as CPB bounces off the channel (say, at around 51.00), and if it manages to reach its most recent highest high at 57.65, then you’re looking at a potential return of $6.65 per share. And if the trade doesn’t go in your favor, you’re probably better off exiting the position.
Disclaimer: This blog is for educational purposes only and should not be construed as financial advice. The ideas and strategies should never be used without first assessing your own personal and financial situation, or without consulting a financial professional.

