
The correction in stock prices may be gathering steam, and the potential for a full blown liquidity crisis seems to be rising. The reason may be that several big players in commercial real estate have recently defaulted on billions of dollars’ worth of loans.
Last week, in this space, I wrote: “Something happened to the markets around Valentine’s Day which could reverse the recent uptrend.” Well, the trend is increasingly wobbly, and we are getting new information which may explain at least part of what’s happening.
Real Trouble in Real Estate
The hotter-than-expected PCE (Personal Consumption Deflator) data grabbed the headlines. But it seems that its arrival on the scene may be more of a catalyst for an already churning dynamic in the market than the cause for the renewed selling on 2/24/23.
Think commercial real estate defaults.
Over the last few weeks, in this space, I’ve reported that several major real estate investors have faced increasing difficulties. I’ve also noted that it is possible that these and other commercial property REITs that have had problems with foreclosures may have been selling U.S. Treasury bonds in order to raise cash to fund operations, as their cash flow dries up due to rising vacancies.
I’ve noted that Brookfield’s LA default (highlighted in prior link) has been well reported, while the even bigger Blackstone (BSX) is also having its share of problems along with Starwood (STWD). Brookfield’s (BAM) CEO Bruce Flatt is calling the L.A. default insignificant, while citing demand for premium space around the world, in places like Dubai, as more than enough to offset the L.A. issues for the company.
Six Bullish Signs that a Short-Term Bottom May be Brewing
The creep up in U.S. Treasury bond yields of late has been due to steady selling from one or more players. The question that matters most for investors is who is doing the selling and why. So far, it’s not clear. But, for now, things seem to have calmed down. And this pause has had a calming effect on the stock market, which may be a worthwhile short-term trading opportunity.
The selling in bonds may have come too far too fast, given the apparent rolling over of yields, on 3/3/23, as I discuss below. Thus, it follows that, if this is the case, then a short-term rebound in stocks is more likely than not.
As a result, there are six short-term indicator reversals in the works for the stock market. And if they hold, they will support higher stock prices. I describe them in detail below. The first one is the pulling back of the U.S. Ten Year note yield below 4%. The other five are related to the technical action in the stock market, including market sentiment, the action in major stock indexes, liquidity indicators, and the market’s breadth.
Meanwhile, although not out of the woods completely, homebuilder stocks may actually have one more price surge, as spooked buyers who have pulled back their horns due to the recent climb in interest rates could return, as they fear that rates will rise again in the not too distant future.
I have recently added several new picks including actionable options to my model portfolio. Check them out with a free trial to my service here.
Is Starwood the Canary in the Coal Mine?
I’ll discuss the homebuilders below. But first, a bit more on commercial real estate.
Investors are clearly losing confidence in companies that invest in commercial real estate. For instance, take the response to real estate giant Starwood’s (STWD) recently reported better-than-expected results. Normally, you’d expect some sort of rally due to the good news. Yet, instead of a move higher, the stock’s price mostly went nowhere. That suggests that confidence in the sector, even in companies that are holding their own, is starting to erode significantly.
Starwood delivered $140 million in profits, a 53% year-over-year increase based on $456 million in revenues, also a nifty 56% year over year increase. CEO Barry Sternlicht shed some light on the status of the commercial market, noting that the multifamily market is “solid” while the commercial market is “bifurcated.” He also added that the U.S. office market is being hampered by the “work from home” dynamic, while noting that the rest of the world isn’t this way anymore.
Perhaps the remark that should have eased investors’ fears was Sternlicht’s comment about Starwood’s exposure to office properties is only 13% of its total portfolio, while adding that the company has “almost no exposure” to New York and San Francisco, where the office markets are struggling more than other areas. He also noted that office markets in states like Texas are doing much better.
Instead, investors seemed to focus on Sternlicht’s comments about the Fed, where he noted that the Fed isn’t likely to bring inflation back to 2% without some sort of miracle occurring.
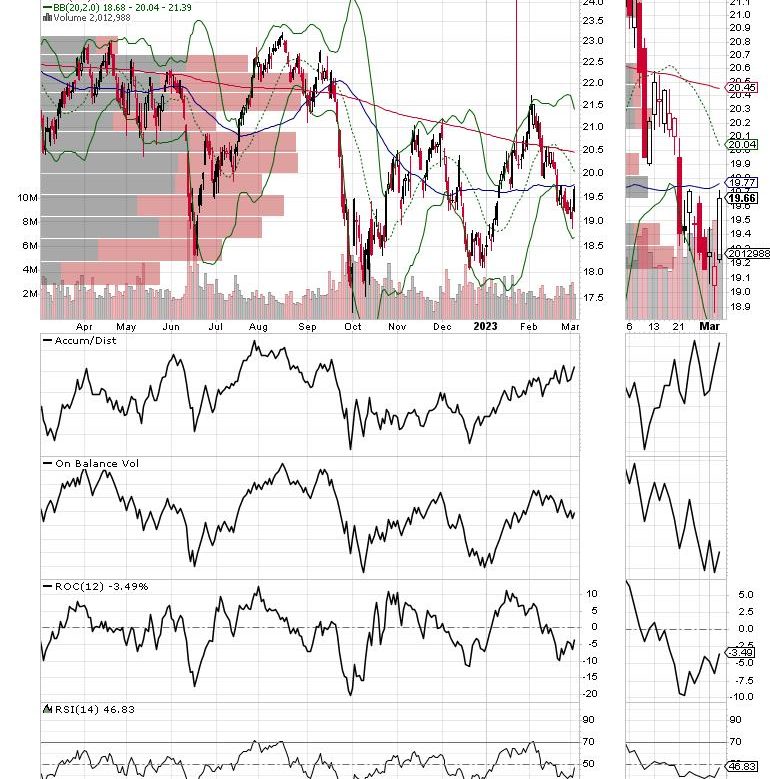
The stock had a token bounce 3/1/23, but almost immediately rolled over and resumed its downward path — only to then rebound once bond yields reversed on 3/3/23. We’ll see how this develops. Certainly, the stock is oversold. Thus, if bond yields take a breather, the shares could bounce for a few days to weeks.
At this point, though, it may pay to look elsewhere, as the Accumulation Distribution (ADI) and On Balance Volume (OBV) indicators are not offering much hope, as ADI’s recent bounce, an indication of short covering, has been overshadowed by the worsening On Balance Volume (OBV). Putting the two together, sellers are taking the opportunity to increase their selling into the temporary rise in prices due to short sellers abandoning the stock.
You can check out both long and short real estate and homebuilder picks here with a free trial to my service.
Why the 4% Yield on the U.S. Ten Year Note Could Help Homebuilders in the Short Run
The first potentially bullish sign of a turnaround in the markets is the action in bond yields.
For several weeks, I’ve been writing about the U.S. Ten Year note yield (TNX) and the crucial 4% yield area. Well, last week, 4% TNX crossed above the key line in the sand for a couple of days before reversing. What that means is that all market interest rates that are tied to TNX may again reset higher in the next week or so, at least temporarily, due to the lag effect.
Among the most crucial rates are those related to mortgages. Already, we’ve seen the troubles in commercial real estate due to higher rates. More recently, we’ve seen homebuilder stocks roll over, as investors factor more decreases in existing home sales, and even new home sales which rebounded in January when TNX fell to nearly 3.5%.
Now, we’ll have to see if this was the top for the current move or whether yields will rise further after a pause. With payroll data due on 3/10 and CPI due out on 3/14, anything is possible.
You can see that mortgage rates have already retraced most of their recent drop and that, once again, the 7% yield is within reach. We’ll see what happens to these rates and what the response from potential home buyers is if there is a slight pullback in rates. My guess is that we will see more action on the housing front in the short term as homebuyers try to lock in current rates before the Fed raises rates again.
The homebuilder sector (SPHB) had been fairly steady in comparison to other areas of the stock market, but the move above 4% on TNX is had a noticeable negative effect on the sector. Not surprisingly, though, as soon as TNX pulled back from the 4% area on 3/3/23, homebuilder stocks rebounded.
That’s not really surprising because, for homebuilders and for sellers of existing homes, the recent and aggressive rise in mortgage rates created a panic scenario. Thus, the potential for a temporary reversal in rates may be beneficial in the short term. Indeed, if those buyers who recently pulled back their bids due to higher rates fear that even higher rates are coming in the not-too-distant future, it will likely spur a boost in the homebuilders shares.
For a detailed explanation of how to manage your portfolio during a liquidity crisis, watch this Your Daily Five video.
Five Technical Signs Which Point to Short Term Bottom
The technical environment for stocks improved on 3/3/23 as bond yields reversed their recent climb and the NYAD, SPX, NDX, VIX, and XED all delivered some positive action. However, if there is going to be a meaningful short term rally, these five signs need to hold.
The New York Stock Exchange Advance Decline line (NYAD) broke below support at its 20-day moving average last week and found support just above its 50-day moving average. This is certainly encouraging, as is the close for NYAD above its 20-day moving average.
Meanwhile, the S&P 500 (SPX) bounced back above the the 4000 area after finding support at its 200-day moving average. This is also bullish.
The Nasdaq 100 Index (NDX) also found support at its 200-day moving average, adding to the short term bullish scenario.
Adding to the sigh of relief, the CBOE Volatility Index (VIX) rolled over, signaling that bearish sentiment is pulling back.
When VIX rises, stocks tend to fall, as rising put volume is a sign that market makers are selling stock index futures in order to hedge their put sales to the public. A fall in VIX is bullish, as it means less put option buying, and it eventually leads to call buying, which causes market makers to hedge by buying stock index futures, raising the odds of higher stock prices.
Liquidity finally stabilized, as the Eurodollar Index (XED) has found new support at 94.75 after breaking below 95, which had been a reliable support level. Usually, a stable or rising XED is very bullish for stocks.
You can learn more about how to gauge the market’s liquidity in this Your Daily Five video.
To get the latest up-to-date information on options trading, check out Options Trading for Dummies, now in its 4th Edition—Get Your Copy Now! Now also available in Audible audiobook format!
#1 New Release on Options Trading!
Good news! I’ve made my NYAD-Complexity – Chaos chart (featured on my YD5 videos) and a few other favorites public. You can find them here.
Joe Duarte
In The Money Options
Joe Duarte is a former money manager, an active trader, and a widely recognized independent stock market analyst since 1987. He is author of eight investment books, including the best-selling Trading Options for Dummies, rated a TOP Options Book for 2018 by Benzinga.com and now in its third edition, plus The Everything Investing in Your 20s and 30s Book and six other trading books.
The Everything Investing in Your 20s and 30s Book is available at Amazon and Barnes and Noble. It has also been recommended as a Washington Post Color of Money Book of the Month.
To receive Joe’s exclusive stock, option and ETF recommendations, in your mailbox every week visit https://joeduarteinthemoneyoptions.com/secure/order_email.asp.