
SPX Monitoring Purposes: Sold long SPX 1/27/23 at 4070.56 = Gain 6.51%; Long on 12/20/22 at 3821.62.
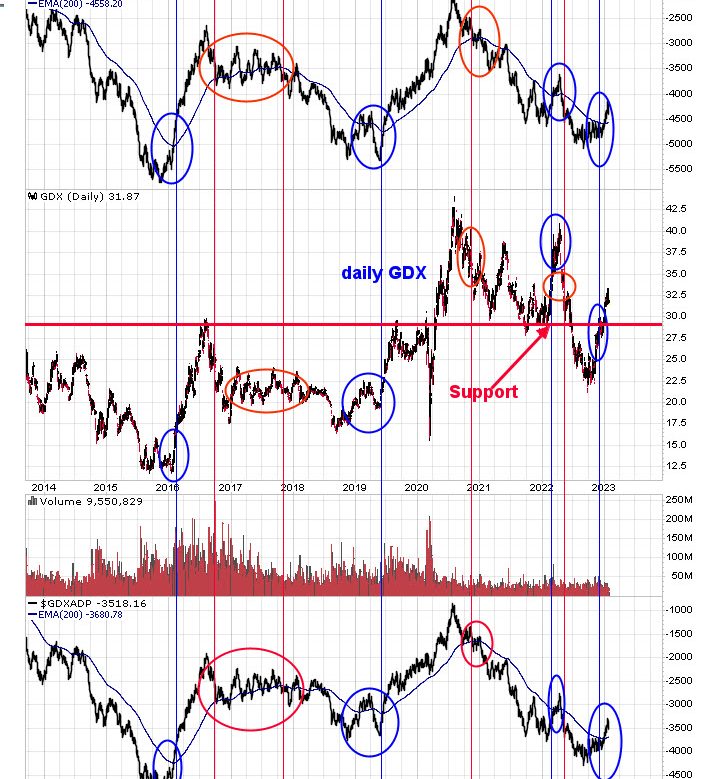
The top window is the cumulative GDX Up Down Volume percent with a 200-day average, and the bottom window is the cumulative GDX Advance/Decline percent with a 200-day average. These types of indicators look at the bigger picture and can have signals that can last two years. The blue lines shows the times when both cumulative up down volume and advance/decline indicators close above their 200-DMA, triggering a bullish signal, and the red lines shown with both indicators close below their 200-DMAs, triggering a bearish signal. In late 2022, both indicators closed above their 200-day moving averages, suggesting an intermediate-term rally began. Don’t know if the current signal will last two years, but notice that both indicators seem to rise and fall in a 1 ½-2 year cycles. The last down cycle in both indicators started in late 2020, and both turned up in late 2022 (minus the hiccup in early 2022); nearly two years.
Tim Ord,
Editor
www.ord-oracle.com. Book release “The Secret Science of Price and Volume” by Timothy Ord, buy at www.Amazon.com.
Signals are provided as general information only and are not investment recommendations. You are responsible for your own investment decisions. Past performance does not guarantee future performance. Opinions are based on historical research and data believed reliable; there is no guarantee results will be profitable. Not responsible for errors or omissions. I may invest in the vehicles mentioned above.