
Last week I featured the S&P 500 SPDR (SPY) with a clear resistance level to beat. Even though the 2022 decline could be a correction after a big advance, the ETF is short of a breakout and trend reversal. The Nasdaq 100 ETF (QQQ) also has a clear level to beat and is challenging resistance.
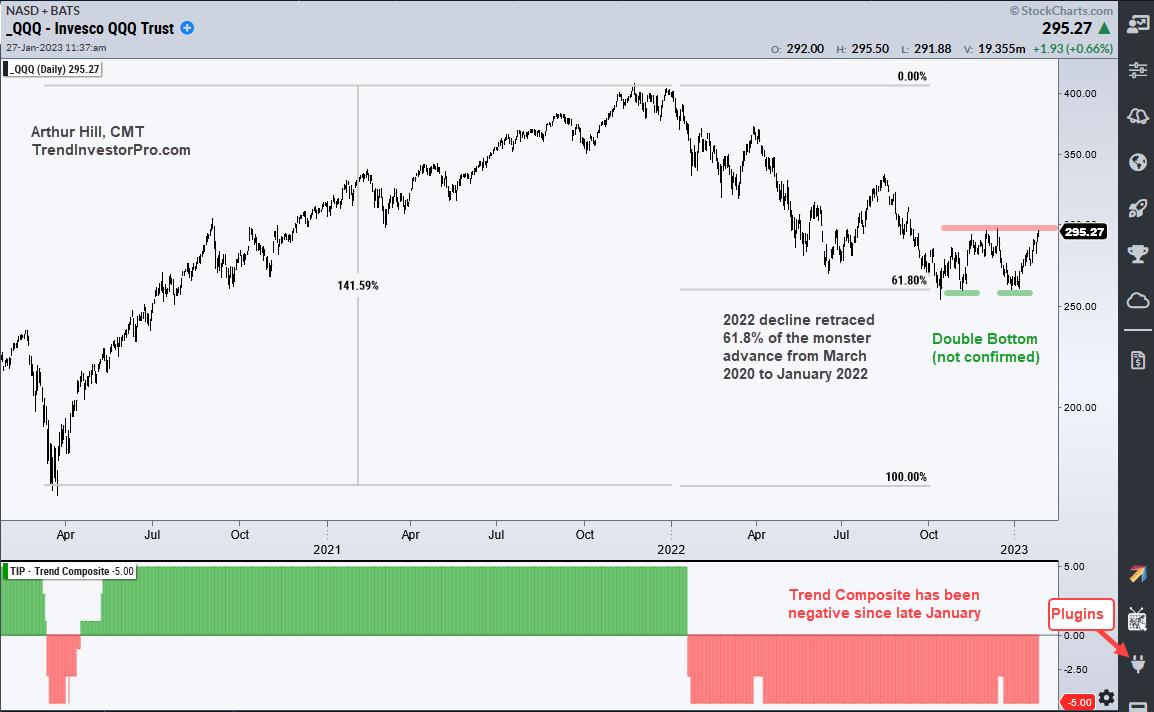
The chart below shows QQQ surging some 140% and then retracing around 61.8% of this advance. This is basically two big steps forward and one step backward. This step backward, however, has yet to reverse and the long-term trend remains down.
QQQ found support twice in the 258 area in early November and late December (green lines). These two equal lows form a potential double bottom and a break above the intermittent high would confirm the pattern. QQQ is challenging the December high as I write and a breakout at 300 would confirm the double bottom.
The indicator window shows the Trend Composite turning negative in late January and remaining negative, which means the downtrend is in force. In addition to a confirmed double bottom, I would like to see the Trend Composite turn positive before turning bullish on QQQ. The Trend Composite aggregates signals in five trend-following indicators and it is at -5 right now, which means all five have bearish signals.
TrendInvestorPro uses the Trend Composite as part of a trend-momentum strategy for trading a basket of ETFs, the All Weather List. This strategy is explained in a ten part series that includes backtest results and a signal table. Click here for immediate access.
The Trend Composite, Momentum Composite, ATR Trailing Stop and eight other indicators are part of the TrendInvestorPro Indicator Edge Plugin for StockCharts ACP. Click here to learn more and take your analysis process to the next level.
—————————————