
Sector Spotlight: Keep An Eye; This Could Be A Massive Multiyear Breakout
There is no debate when it comes to concluding that 2022 has been a choppy year for equities globally. The markets had to deal with all sorts of things; rising inflation, fear of recession, geopolitical tensions, and a slew of rate highs from the central banks all over the world. Having said this, these situations presented us with a need almost all the time to stay invested in a sector that is resilient and presents stability to at least a portion of any investor’s portfolio. The NIFTY PSE Sector, represented by NIFTY PSE Index ($CNXPSE) is one such sector.
The NIFTY PSE Index comprises of companies in which 51% of outstanding share capital is held by the Central Government and/or State Government, directly or indirectly.
A glance at the weekly charts presents an interesting picture; a glance at the long-term monthly charts presents an even more interesting picture which is the real source of excitement. Let us begin with the weekly chart first.
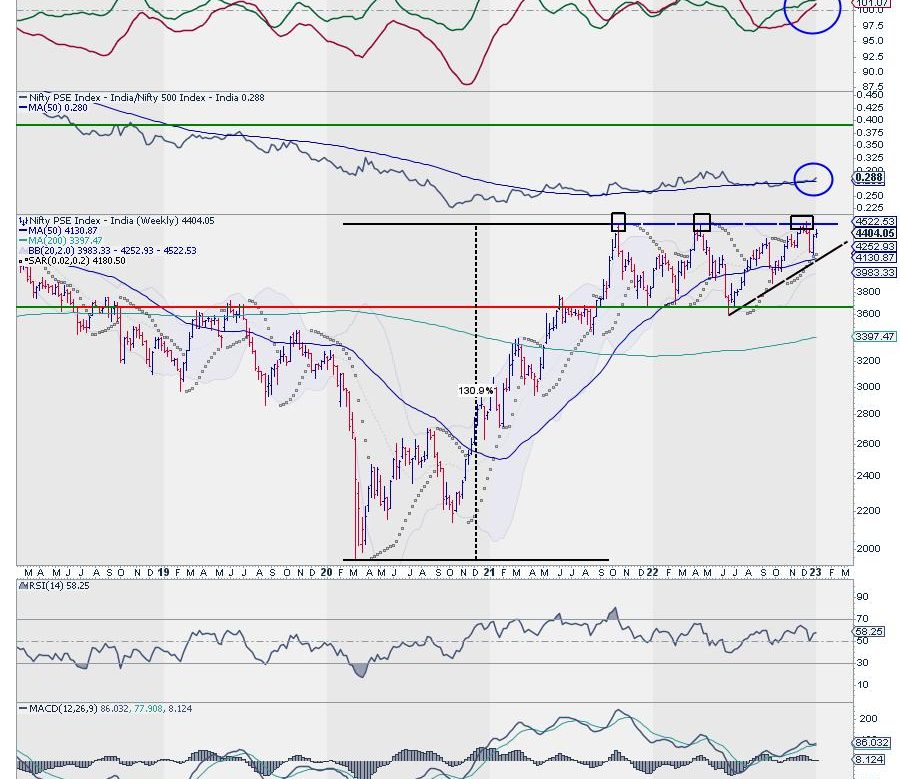
After forming the pandemic lows in March 2020, $CNXPSE has risen 130% as of today. It rose from the lows formed near the 1960-1990 zones and formed its peak above 4400 levels in October 2021. Despite resilient relative performance many times in the past year, this sector has not returned anything practically over the last 14 months as it stays at the same level that was seen in October 2021.
Looking from a short to medium-term perspective, it is seen oscillating in a trading range of 3650-4450 levels. The level of 4400 has been tested at least thrice since October 21; it appears to be making higher bottoms within this area pattern and may stage a breakout if it moves meaningfully above 4500 levels.
That is not all. If we zoom out and take a long-term view, this is where the real excitement comes in. Let us take a look at the long-term monthly chart of $CNXPSE.
Following its inception in January 1995, the NIFTY PSE Index marked its low point near 325-330 levels in September 2001. Beginning from this time until the peak formed near 4400 in January 2008, this index ended up returning impressive 1400+% returns in just over 6 years. However, from January 2008 until now, the index has not returned anything in 14 years as it stays at the same level today as it was in January 2008.
Intermittent outperformance apart, the Index tested the 4400-4500 levels in January 2008, a few times between September and December 2017, and a few times over the past 14 months.
This translates into the fact that unless you invested in the PSE pocket during pandemic lows, you have received well over 130% returns; however, if you are invested since 2008, you have received nothing over the past 15 years.
How would Investors track and stay invested in this pocket?
The answer to this could be in perhaps two ways.
For Active Investors, it would mean actively tracking the rotations and staying invested in the stocks with strong relative momentum within the Nifty PSE Index. As of now, the picture stands as under:
The above RRG shows NIFTY PSE Constituents benchmarked against the NIFTY PSE Index. The ones circled in blue and green are the ones that are seen relatively outperforming the benchmark.
For Passive Investors, the approach may be slightly different. They may just stay invested in the Index constituents in the proportion of their weight in the Index.
Interestingly, the NIFTY PSE Index is made up of 20 stocks. However, the top 10 stocks represent 76.37% of the Index. Tracking and staying invested in these stocks should serve the purpose enough!
What makes this pocket resilient and safe?
This group enjoys a positive to strongly positive correlation with the frontline NIFTY 50 Index. Over the past year, it has seen a correlation of 0.63, but over 5 years and since inception, it has seen a correlation of 0.70 and 0.74 with the Nifty.
The safety and resilience come with the Beta that this sector has against the NIFTY. It has a Beta below 1. Over the last one year, it has seen a Beta of 0.71. Over the last 5 years and since inception, it has a Beta of 0.83 against the NIFTY. This has ensured that in turbulent times, this group of stocks has declined less than the frontline index.
Conclusion?
Pretty much straightforward and simple. Watch out for a meaningful move above 4450-4500 in this index and we may be in for a multiyear breakout in this index!
Founder and Technical Analyst,