
As the great bear market of 2022 was really hitting its stride, the 3800 level came into view as a likely support level for stocks. We keyed in on that level based on Fibonacci Retracements using the March 2020 low and the January 2022 high. At the time, that seemed like an aggressive downside target, and we instead focused on shorter-term objectives using the September 2020 low (not as significant as the March 2020 low, to be sure, but still an important consolidation point during the 2020-2022 uptrend).
So now, in January 2023, we are once again testing the 3800 level. Friday’s price action seems to put an exclamation point on the importance of this support level. How bearish can the markets be if we remain above SPX 3800?
I would argue that, while the major trend is still down, we are now in a consolidation phase. Here’s why.
Setting the Stage with Fibonacci
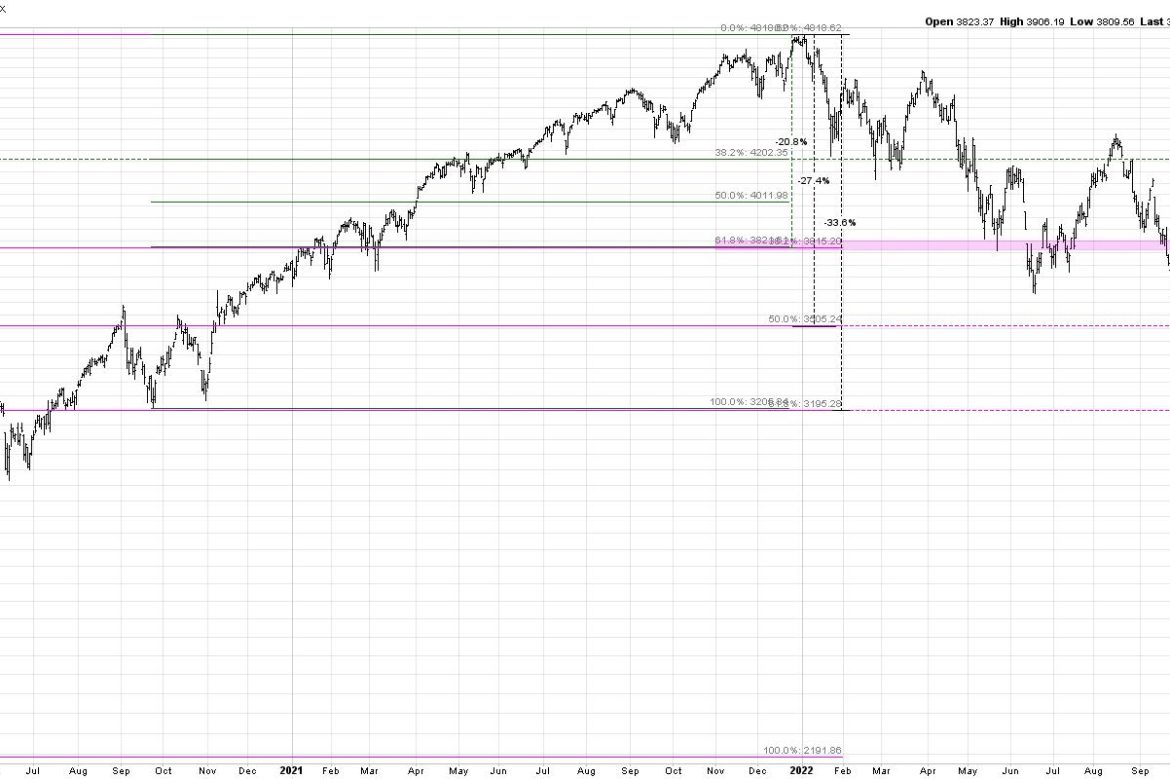
Reviewing the long-term chart of the S&P 500 index, you can see the larger Fibonacci framework using the March 2020 low (pink lines) as well as the secondary framework using the September 2020 low (green lines).
3800 represents about a 21% drop in absolute terms from the all-time high in January 2022. The pink-shaded area indicates the alignment of the two Fibonacci frameworks, and shows why 3800 is indeed an important level to watch.
Quick question: what return would it take to get from 3800 back up to 4800 and recover that 21% loss? Answer: 27%!
If we take an even shorter-term framework, using the October 2022 low and December high, you’ll note that 3800 is about a 50% retracement of that recent upswing.
So, based on a number of different time frames, we are seeing clear evidence that 3800 appears to be a pivot point for the S&P 500.
Further Evidence Using Price and Momentum
Now, while Fibonacci Retracements certainly have some value on their own, any potential support or resistance level is further validated when the price action demonstrates the importance of the level. To put another way, the more times you test a particular level, the more significant it becomes. So the fact that the market has basically sat on this 3800 level since mid-December is arguably the most important argument that this level is valid.
Now, let’s review the momentum characteristics using RSI.
When the S&P rose to its August peak, the RSI became overbought (above 70). On the subsequent move to new lows, the RSI dropped below the oversold threshold (below 30).
I’m super excited to be a part of Market Vision 2023 hosted by Tom Bowley, founder of EarningsBeats and a long-time StockCharts contributor! I’ll be sharing my “one chart” to use for 2023, and will also join Grayson Roze and Julius de Kempenaer in providing our S&P 500 projections for the year along with key sectors to watch. Sign up HERE for this free event, airing Saturday 1/7/22!
Now look at the early December peak. See how the RSI failed to break above the 60 level? On the mid-December pullback to 3800, note how the RSI failed to break below 40. We are now experiencing a consolidation phase, as the range narrows, the volatility remains muted (the $VIX remains near 20 and has not risen as the market pulled back), and the RSI is reaching less extreme levels.
All of this combines to tell the story of a market trapped in a range between 4100 on the upper end and 3800 as support.
What’s Next for the S&P 500?
When the market settles into a consolidation phase, I find it’s best to identify some “lines in the sand” — levels above which or below which you decide to take action. Until then, we are in wait-and-see mode.
I could envision the S&P pushing back above 4100, especially if we continue to see lukewarm economic data encouraging investors that the Fed may begin to wrap up this tightening cycle sooner rather than later. That said, given the headwinds that exist for growth stocks in a rising rate environment, I just don’t see our growth-oriented benchmarks recovering much further than that (yet!).
I very much see a break below 3800 as a likely outcome here, with a break to new lows likely if that occurs. My downside target for the S&P 500 remains 3200, and all we need is some strong economic data and/or hawkish tones from Fed governors to make that a reality.
In either scenario, we would first need to break above 4100 or below 3800. And I would propose that, whichever way breaks first, that will indicate the likely direction of the market in the coming weeks and months.
Want to digest this article in video format, just head over to my YouTube channel:
RR#6,
Dave
P.S. Ready to upgrade your investment process? Check out my YouTube channel!
David Keller, CMT
Chief Market Strategist
StockCharts.com
Disclaimer: This blog is for educational purposes only and should not be construed as financial advice. The ideas and strategies should never be used without first assessing your own personal and financial situation, or without consulting a financial professional.
The author does not have a position in mentioned securities at the time of publication. Any opinions expressed herein are solely those of the author, and do not in any way represent the views or opinions of any other person or entity.