
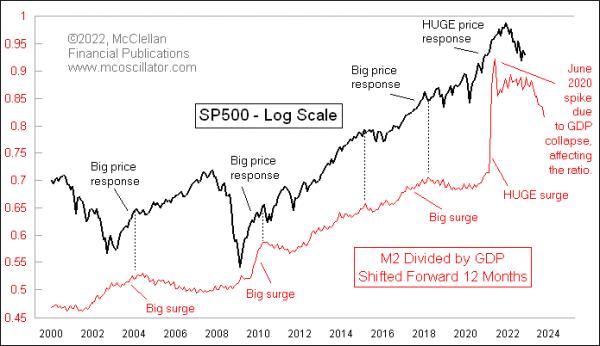
The Fed boosted the size of the money supply in a huge way because of COVID, exacerbating an upswing that was already underway in the ratio of M2 to GDP featured in this week’s chart. The cool thing about this ratio is that it tells us what is ahead for the stock market about a year ahead of time. It does so imperfectly, but it is still a useful message to listen to. And now this ratio is falling, faster than it ever has before, so we are going to get to find out what that means.
When the economy expands, there is a need for more currency to lubricate all of the financial transactions taking place. So, if the size of the money supply expands at the same rate as GDP, then there is no imbalance. If, however, the Fed increases the money supply faster than the growth in the economy, then there is excess currency that needs a mission. So that money goes looking for a job, and it tends to find gainful employment pushing up stock prices. But the key is that there is currently about a 1-year lag in this relationship.
It used to be a coincident relationship back in the 1960s and 1970s, and so brokers would gather every week around the Quotrek machines when the news was released about what M1 and M2 were doing. By the 1980s, it had changed from a coincident relationship to one that lagged about 6 months. And now, in the 21st century, the lag time is about a year. See more on this change over time here.
We are seeing something now that we have never seen before in all of the history of these monetary aggregate indices, history which goes back to 1959. M2 is shrinking, as the Fed is trying to unwind all it did when trying to “help” during COVID. And GDP is still growing, so the amount of money sloshing around compared to the size of the economy is shrinking at the fastest rate ever. This is uncharted territory, and it is a grand economic experiment that the Fed is conducting. It is not clear what is going to happen by changing this M2/GDP ratio downward at such a fast rate. We will all find out over the next year or so.
What I can say, though, is that the stock market likes it a whole lot better when the M2/GDP ratio has been surging upward. That reliably leads to a big price response about a year later. After the instances when the M2/GDP ratio has gone to a more flat path, the S&P 500 has tended to move more sideways. So, if this positive correlation holds true for this new condition that has never been seen before, with the M2/GDP ratio falling at a rapid pace, then the implication is that stock prices are going to have an awful year in 2023. But again, this is something that has never happened before, so we cannot “know” for sure what it is going to mean.