
The Fed hiked by 50 basis points, as the market was expecting. Major U.S. indices turned red on the news with a modest day of losses. DIA closed negative, but stayed above its 50- and 200-day moving averages, as well as its 50- and 200-week moving averages. The SPY and IWM closed below their 200-day moving average. The weakest US Index, QQQ, closed near its 50-day moving average.
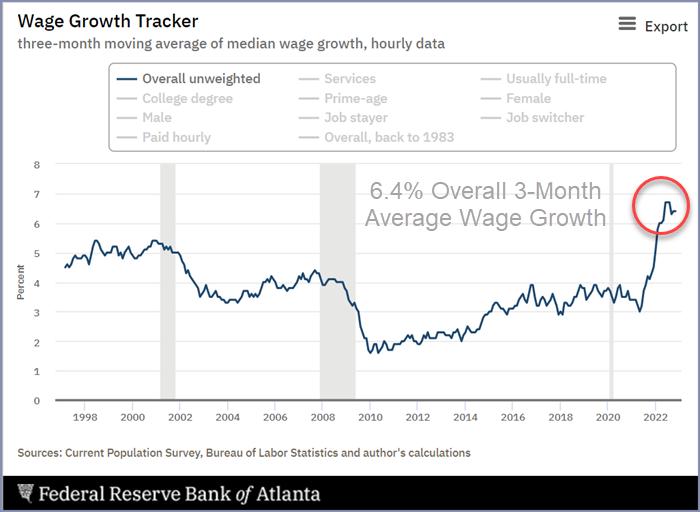
Tuesday’s CPI numbers were softer than anticipated, but do not assume that inflation is now decelerating, and a soft landing is looking more likely. Looking at the inflation data, reaching the Fed’s neutral rate of 2% inflation will take a very long time. The CPI is currently at 7.1% year over year, wages grew a staggering 6.4% in the last three months alone, and food costs have increased 10.6% over the previous year.
Much of core inflation is coming down, but shelter, which is 30% of CPI, is still rising at 7.1%. The Fed has been able to slow down the housing market with a succession of significant rate hikes, making many homes unaffordable to people that could afford the same house a year ago. So those people are now renting and not buying. Higher interest rates are not intended to lower rents.
Food costs have risen over 10.6% this year and are up 0.5% from last month alone. The chart of food at home below is trending much higher.
Energy is another significant component. Supply chains have recovered, and some inflation components were bubbles, like used car prices. Services are rising, like education and healthcare, and are tied closely to wage growth since businesses pass on these costs. By monitoring wage growth and food prices, you can determine the general direction of inflation.
As you consider the upcoming months, pay close attention to these two economic indicators below. Both are reasonably accurate at predicting future recessions and are signaling that a recession is potentially ahead.
The yield curve between the 10-year and the 2-year has inverted to levels not seen since the early 1980s. An inverted yield curve has accurately predicted the last six recessions.
The Conference Board Leading Economic Index (LEI) for the United States has long been lauded as a reliable leading indicator of recessions, and, in October, LEI declined 0.8%, following a decline of 0.5% in September. The LEI is now down 3.2% over the six months between April and October 2022, predicting a U.S. recession.
Nobody anticipated that the Federal Reserve would be able to stop inflation quickly. But, despite the sharp rise in interest rates, the central bank has only begun to win the battle to contain inflation.
If you want to take advantage of our proprietary trading indicators, contact Rob Quinn, our Chief Strategy Consultant, who can provide more information about Mish’s Premium Trading Service.
Click here to learn more about Mish’s Premium trading service with a complimentary one-on-one consultation.
“I grew my money tree and so can you!” – Mish Schneider
Get your copy of Plant Your Money Tree: A Guide to Growing Your Wealth and a special bonus here.
Follow Mish on Twitter @marketminute for stock picks and more. Follow Mish on Instagram (mishschneider) for daily morning videos. To see updated media clips, click here.
Mish in the Media
Read Mish’s latest article for CMC Markets, titled “Two Closely-Watched ETFs Could Be Set to Fall Further“.
Mish talks the current confusion in the market in this appearance on Business First AM.
Mish discusses trading the Vaneck Vietname ETF ($VNM) in this earlier appearance on Business First AM.
Mish discusses the importance of not adding trading risk into the rest of the year in this earlier appearance on Business First AM.
Read Mish’s previous article for CMC Markets, titled “Commodities to Watch in December“.
Mish talks stagflation in her interview by Dale Pinkert during the F.A.C.E. webinar.
Watch Mish’s appearance on Business First AM here.
Mish hosted the Monday, November 28 edition of StockCharts TV’s Your Daily Five, where she covered some of the Modern Family. She also discusses the long bonds and gold with levels to clear or, fail.
Mish discusses “Macro & Market Analysis – Winning Trades in All Markets” in this appearance on the podcast The RO Show with Rosanna Prestia.
ETF Summary
S&P 500 (SPY): The 50-WMA looms above with resistance at 410; unless that level is cleared, SPY could fall to the 50-DMA support level at 380.Russell 2000 (IWM): 190 is resistance, 177-180 support must hold.Dow (DIA): The only index above its 50-WMA; Tuesday’s action may have spawned a key reversal top if DIA cannot reach 348 again.Nasdaq (QQQ): Matched recent highs at 297 before selling off on Tuesday; can it hold 277?Regional banks (KRE): 57 support, 60 pivotal.Semiconductors (SMH): Tested 230 and its 50-WMA, then declined. 223 support, hit support today; next key level of support is 220.Transportation (IYT): Ran to its 50-WMA and sold off, 218 last level of support. 231 resistance, 223 first level of support.Biotechnology (IBB): Best sector in a consolidation mode, unless it breaks below 130.Retail (XRT): Never cleared over 67; now we watch 63 as major support.
Mish Schneider
MarketGauge.com
Director of Trading Research and Education
Wade Dawson
MarketGauge.com
Portfolio Manager