We were somewhat surprised today when we reviewed the index ETFs. Two ETFs actually show rising momentum. Don’t get too excited, there are problems on both of their charts. For comparison, SP500 (SPY), Dow (DIA), Nasdaq 100 (QQQ), SP100 (OEX) and Nasdaq (COMPQ) all have negative momentum and are on SELL signals. Those are just a few, I’m sure we could dig up others.
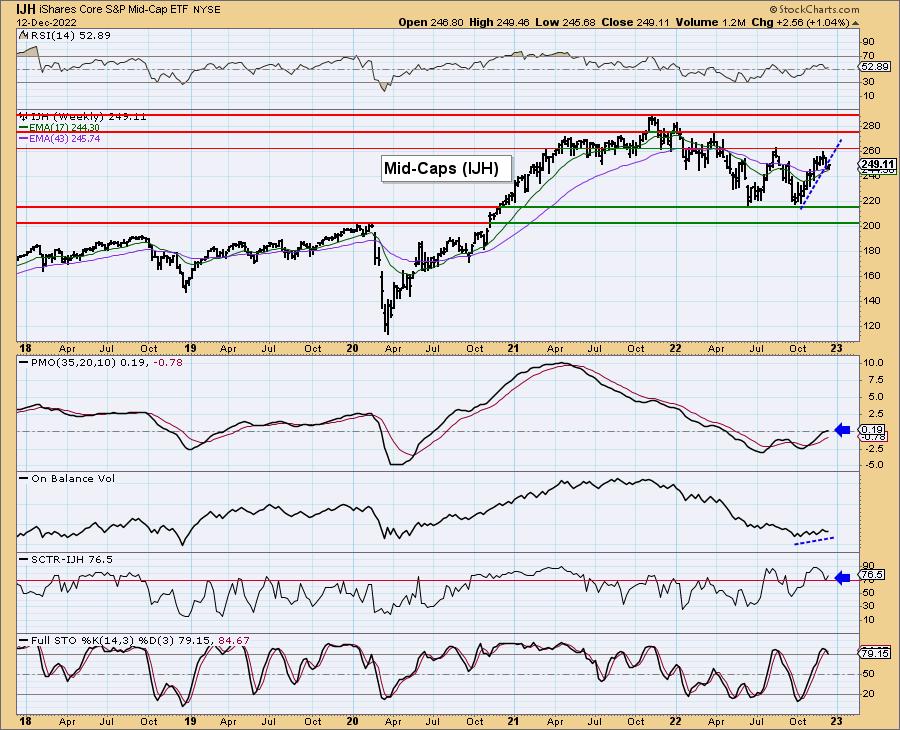
First is the SP400 (IJH). Notice that not only is the Price Momentum Oscillator (PMO) rising, it just hurdled the zero line. The RSI turned up on today’s rally, keeping it in positive territory and the OBV is rising with price. Additionally, the StockCharts Technical Rank (SCTR) is above 70 or in the “hot zone”. The “hot zone” is territory above 70%. That indicates that based on trend and condition in the intermediate and long terms, a stock or ETF is in the top 1/3rd of its universe. In this case, the universe is ETFs.
Two problems here: 1) Stochastics have topped and moved below 80 and 2) The short-term rising trend has been broken and even with today’s rally, not recaptured.
Second is the SP600 (IJR). The PMO is decelerating, but still rising toward the zero line. The RSI remained positive with today’s rally. Unfortunately, like IJH, Stochastics have topped and are below 80 and the short-term rising trend as well as horizontal support have been broken and not recaptured. IJR also has the issue of a SCTR that is well outside the “hot zone” above 70%.
While it may appear that small- and mid-caps are a great place to be, looking at the Russell 2000 (IWM), this is not the case. When you add all of the other “cats and dogs” that are in IWM, the picture is not so bright. There is a rounded top, the RSI is negative, the PMO is on a SELL signal and declining. Stochastics have turned up in oversold territory, but it is way too early to trust them. The relative strength line tells the story of IWM and gives us a pretty good idea where it is headed.
Conclusion: While IJH and IJR look somewhat bullish, IWM is a disaster. A rising tide may lift all boats, but we don’t see IJH and IJR leading that charge.
Watch the latest episode of DecisionPoint on StockCharts TV’s YouTube channel here!
Don’t miss our Super Secret Sale! Prices Go Up in January!
We’ve decided to keep our “Super Secret Sale” running for a few days longer. It is ONLY for those who follow DecisionPoint.com blogs, shows and free email list subscribers (sign up on our homepage!). Subscribe HERE!
Buy one month and get your second free until December 15th!
Our prices will be going up substantially in January, but you can lock in our current low rates by subscribing now! Our Bundle is $68/mo, it will be going up to $119/mo! Current subscribers have locked in their low rates, time for you to lock in those rates! Subscribe HERE!
Technical Analysis is a windsock, not a crystal ball. –Carl Swenlin
(c) Copyright 2022 DecisionPoint.com
Helpful DecisionPoint Links:
DecisionPoint Alert Chart List
DecisionPoint Golden Cross/Silver Cross Index Chart List
DecisionPoint Sector Chart List
Price Momentum Oscillator (PMO)
Swenlin Trading Oscillators (STO-B and STO-V)
DecisionPoint is not a registered investment advisor. Investment and trading decisions are solely your responsibility. DecisionPoint newsletters, blogs or website materials should NOT be interpreted as a recommendation or solicitation to buy or sell any security or to take any specific action.

