
At the Edge of Chaos: Big Move in Stocks Ahead; Lower Interest Rates Fuel Rally in Homebuilder and Builder Materials Sectors
The stock market is preparing for a big move as volatility bands tighten around the major indexes. There are three major factors to consider at the moment: tax selling, the Fed, and sector specificity.
Technical developments, see below, suggest the market is weakening. It’s time to be cautious.
The Fed
Things can change, and will likely do so instantly in this market as the Federal Reserve’s December 14 interest rate announcement and future guidance about interest rates unfolds. The response will likely shape what the stock market does for the remainder of the seasonally bullish year-end period and into 2023.
So far, seasonality has been much stronger than anyone could have expected, although that may change ahead of the Fed’s upcoming meeting — especially given the Fed’s ongoing push toward higher rates and the recent stronger than expected PPI numbers. Much of the resilience in stocks, however, has resulted from the huge bull move in bonds, where long-term yields have fallen below key support levels as bond traders bet on a recession.
Still, the market has weakened lately as investors are wary of the Fed and also because of tax loss selling, as I describe below. The net result is that the advance in stocks of late has been very selective and sector-specific.
Tax Selling Season Hits Stocks
If you’re wondering why the stock market is not making much headway at the moment, it’s because there are a lot of sellers in the mix.
In fact, the number of outright sellers is greater than the number of short sellers. That’s because investors are selling their losing stock positions in order to reduce their tax burdens. You can see this in the chart of the S&P 500 (SPX), see below, where On Balance Volume (OBV), which is a fairly accurate way to measure buyers and sellers, is on a downward trend, which accelerated last week. On the other hand, the Accumulation Distribution indicator (ADI), which gauges the activity of short sellers, is fairly stable.
Together, these indicators suggest that we are seeing a fair amount of tax-related selling, as investors with losing positions are selling in order to reduce their tax burden for the year. This type of action can certainly pressure the market further, especially if the Fed says or does something especially hawkish on 12/14.
Sector Selectivity: Lower Interest Rates Benefit Homebuilder and Materials Sector
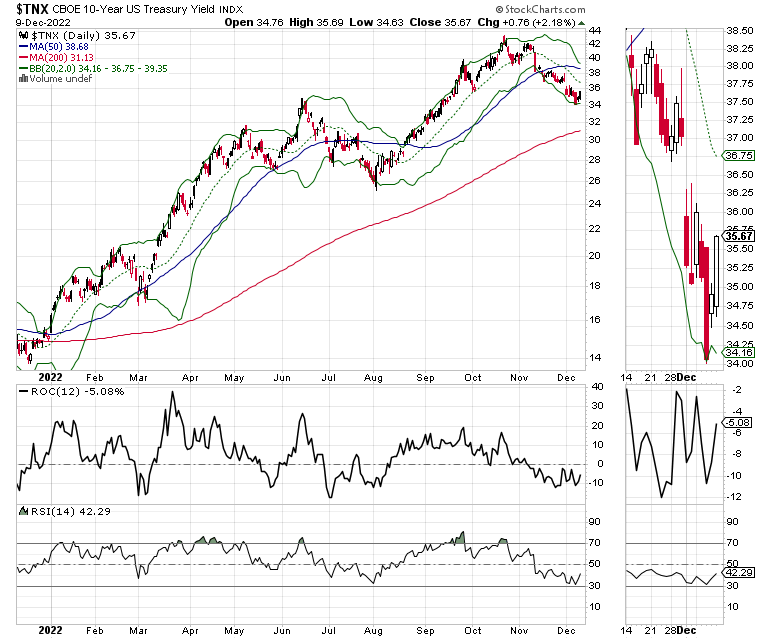
The bond market continues to bet that the economy will slow down significantly due to the Fed’s interest rate increases — so much so that the U.S. Ten-Year Note yield (TNX) is straddling the 3.5% area.
The fall in yields has led to an equally significant fall in mortgage rates, where the average 30-Year mortgage fell to below 6.5% from its recent high above 7%. If mortgage rates fall below 6.25%, expect an improvement in the housing sector.
The fall in mortgage rates has given a short-term boost to homebuilder and homebuilding material stocks. I recently recommended shares of insulation manufacturer and installer Installed Building Products (IBP) to subscribers.
The stock is on the verge of a significant move higher as investors start to price in a continuation of the company’s recently bullish quarter and positive outlook. The company delivered record earnings and revenues while expanding its margins.
What makes this performance more remarkable is the fact that the quarterly report was based on data culled when interest rates were rising. That means, that as I’ve noted here multiple times, homebuilders remain in the driver’s seat due to supply constraints. Moreover, IBP’s business has been resilient as homebuilders manage their book of business with much more restraint than they have in the past. My point is that, with lower interest and mortgage rates, this quarter should at least meet, or perhaps beat expectations due to the influx of buyers who were putting off making a decision due to higher rates.
The stock looks ready to launch higher once it clears the $90-$92 area, as OBV and ADI are starting to turn up. Even better, the stock is now trading above the large VBP bar near $90, which suggests that buyers are starting to overwhelm sellers and short sellers.
After all is said and done, it seems that the prevailing bet in the bond market is that economy is slowing rapidly. For stock traders, the other side of the bet is that the sudden slowing will likely prompt the Fed to resort to QE once again.
Until December 14, it’s probably okay to believe this. But once the Fed does whatever it’s going to do, and Powell utters the first few words in his press conference, anything can happen.
Welcome to the Edge of Chaos:
“The edge of chaos is a transition space between order and disorder that is hypothesized to exist within a wide variety of systems. This transition zone is a region of bounded instability that engenders a constant dynamic interplay between order and disorder.” – Complexity Labs
Bollinger Bands Predict Big Move Ahead for Stocks. NYAD Fails at 200-Day Moving Average.
The New York Stock Exchange Advance Decline line (NYAD) made a new high on 12/2/22 before rolling over, as tax selling season heats up and the Fed’s 12/14 rate hike date approaches.
In fact, NYAD, as it did during the summer rally, has failed to move above its 200-day moving average, a negative development. It also broke below its 20-day moving average and is about to test its 50-day line. A failure at the 50-day line will likely trigger bigger selling in stocks.
Meanwhile, the CBOE Volatility Index (VIX) has reversed course after recently making what looked as if it could be a bullish bottom. When VIX rises, stocks tend to fall, as rising put volume is a sign that market makers are selling stock index futures in order to hedge their put sales to the public. A fall in VIX is bullish, as it means less put option buying.
The Eurodollar Index (XED) remains a bright spot as it may have bottomed out in the short term. That is usually a sign that liquidity is improving. We’ll have to see what happens after the Fed’s 12/14/22 move.
The Bollinger Bands (green bands above and below prices) for the S&P 500 (SPX) are getting tight. That means that volatility is decreasing and the market is coiling up for a big move as the Fed’s 12/14/22 meeting approaches.
SPX is trading just below its 200-day moving average. with the 4000-4100 resistance level looming above. Accumulation Distribution (ADI) is in better shape than On Balance Volume (OBV). That means that rising prices, when they occur, are resulting from short covering, not actual buying. Critical support remains at 3800-3900.
The Nasdaq 100 index (NDX) remains rangebound between 11,000-12,000, with its Bollinger Bands also tightening around its 20-day moving average. ADI and OBV are similar to SPX.
To get the latest up-to-date information on options trading, check out Options Trading for Dummies, now in its 4th Edition—Get Your Copy Now! Now also available in Audible audiobook format!
#1 New Release on Options Trading!
Good news! I’ve made my NYAD-Complexity – Chaos chart (featured on my YD5 videos) and a few other favorites public. You can find them here.
Joe Duarte
In The Money Options
Joe Duarte is a former money manager, an active trader, and a widely recognized independent stock market analyst since 1987. He is author of eight investment books, including the best-selling Trading Options for Dummies, rated a TOP Options Book for 2018 by Benzinga.com and now in its third edition, plus The Everything Investing in Your 20s and 30s Book and six other trading books.
The Everything Investing in Your 20s and 30s Book is available at Amazon and Barnes and Noble. It has also been recommended as a Washington Post Color of Money Book of the Month.
To receive Joe’s exclusive stock, option and ETF recommendations, in your mailbox every week visit https://joeduarteinthemoneyoptions.com/secure/order_email.asp.