
It’s been a long 2022 for many in the stock market as we’ve seen all-time highs in early January morph into one of the worst bear markets since 1950. While we’ve seen a significant decline in equity prices, the market environment now is MUCH different than it was at the beginning of the year – and that’s very bullish.
At our MarketVision 2022 event on Saturday, January 8, 2022, I was extremely cautious. Price action remained solid, but that was about the only thing the bulls could feel good about. Unfortunately, price action is the only thing that most investors look at. Accordingly, many were blindsided when the distribution period from January through May took place. Everyone was selling. All. Day. Long. But that was not the cause of the 2022 problems. It was the EFFECT. The warning signs were everywhere, if you only cared to look, or to consider the bearish argument. I remember being soundly criticized by many for calling for a bear market long before the major indices dropped the “required” 20%. As I said then, “you don’t need to see a twister in your dining room to realize a storm is approaching.”
The good news is that 2023 is likely to be better. Much, much better. Of course, I reserve the right to change my mind between now and MarketVision 2023, to be held on Saturday, January 7, 2023, but so much has changed since the beginning of the year, and it’s all been for the better, except price action. So once again, the question you must ask yourself is, “are you willing to consider the bullish argument now or are you stuck looking at downtrending prices with no ability to look beyond that?”
Here are the 5 things you need to know NOW:
It’s Cyclical, Not Secular
I’ve said this all year long and I’m just as convinced today as I’ve been at any point in 2022. We’ve just concluded a cyclical bear market, folks. It’s over. Is that a guarantee? Of course not. I don’t have a crystal ball. I don’t know how much crazier Fed Chief Powell might get. He and his Fed cronies tried to ruin Christmas in 2018 during the trade war with interest rate hike rhetoric that never transpired. Perhaps he doesn’t like the holidays? But after a series of BIG interest rate hikes in 2022, stock valuations came crashing down, especially growth stock valuations. I’m seeing lower rates on the horizon, which will send those same valuations shooting back higher.
I wrote an article back in January 2022, laying out my “4 Bold Predictions About This Bear Market”. If you didn’t read the article, this would be a great time to do so. We have the tools (especially here at StockCharts.com) to educate ourselves, if we’re willing to put in the time and effort. Many technicians are perma-bulls or perma-bears, only writing articles that support their biases. I’ve been called a perma-bull many times, and admittedly, I’m generally bullish. I think that’s a good thing as the stock market rises a lot more than it declines. I hope that anyone who thought I was a perma-bull now reflects and realizes that I call what I see. Bullish or bearish, it doesn’t matter. I’m going to tell you what I’m seeing. Yes, the bulls will get the benefit of the doubt, because again, the market goes up more than it goes down.
On Saturday, January 7, 2023 at MarketVision 2023, I will tell you what I’m seeing and give my predictions for calendar year 2023. This will be a FREE event and everyone subscribed to our EB Digest newsletter will be invited to attend. If you haven’t already subscribed, this is a GREAT reason to subscribe. Other similar events are priced in the hundreds, or even thousands, of dollars. Yet, StockCharts.com will be joining us at EarningsBeats.com for our 4th annual MarketVision event and it’s FREE and very educational. This allows EVERYONE to attend and learn about techniques that you can use to better forecast market direction and feel more confident about your investing decisions. Stop listening to CNBC. They are an entertainment channel. In the words of their very own Jim Cramer, “THEY KNOW NOTHING!” (Actually, the big Wall Street firms know plenty, they just keep it to themselves)
Do you want to attend MarketVision 2023 for FREE and learn more about the stock market? Then CLICK HERE to sign up for our EB Digest newsletter and we’ll make sure you get room instructions when the event approaches.
Regression To The Mean
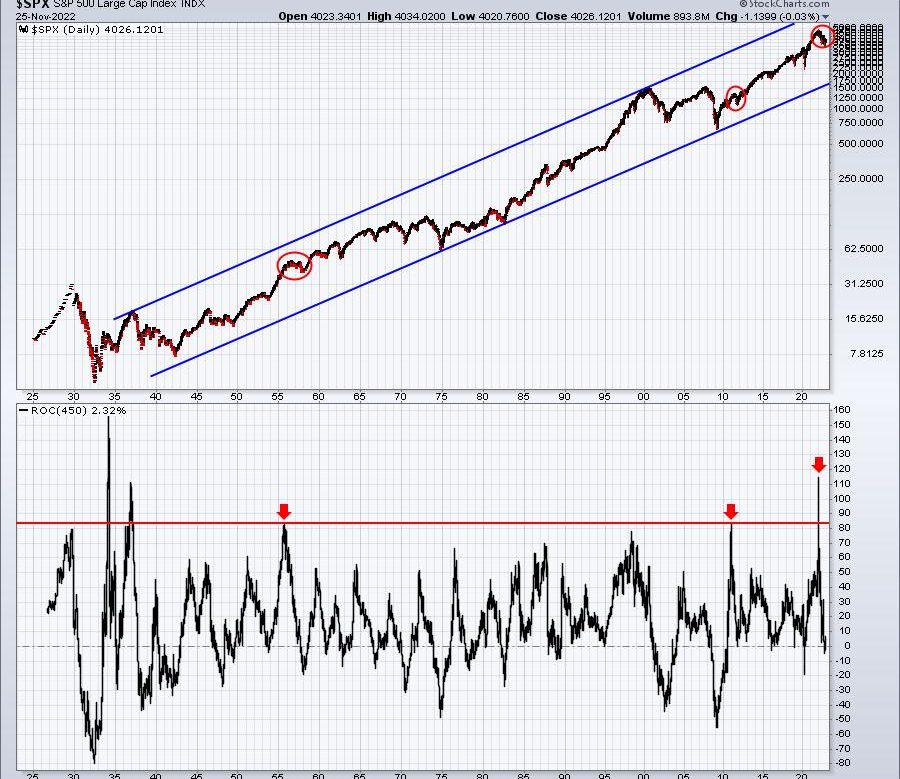
I pointed this out to begin 2022, but it’s a lot easier to see now. The S&P 500 gained 115% over 22 months leading up to its all-time high in January 2022. That type of appreciation is simply unsustainable. The U.S. stock market, coming off the 2020 pandemic, ran too far too fast and we were going to pay the price in 2022. Here’s a daily chart going back 100 years with a 450-day rate of change (ROC) below the price chart (there are 253 trading days in a calendar year, so 450 days represents 21-22 months of trading):
Since the 1930s, we had seen the S&P 500’s 21-22 month rate of change hit 85% only twice. By the beginning of 2022, we hit 115%!!!!!! This crazy advance, together with off-the-chart bullish sentiment suggested we be extremely careful entering 2022. But was CNBC telling its viewing audience to be careful, while the big Wall Street firms were rapidly rotating to defensive sectors in December 2021? Of course not. That doesn’t pay the bills. Instead, they’ll continue to rotate their seasoned entertainers. In my opinion, there’s maybe a handful of true experts worth listening to on CNBC throughout the year. The rest will flip-flop or allow their pre-conceived biases shine through, resulting in nothing but bad analyses and market losses.
Listen, if you were unbiased to begin 2022, how could you look at the massive move higher from March 2020 through December 2021 and not at least consider that the stock market needed a break? Here was the S&P 500 15-year weekly chart that I showed to MarketVision 2022 attendees nearly a year ago, and where we stood as of January 8, 2022:
There were multiple warning signs on this one chart. First, look back at 2014/2015. We broke just outside the upper channel line and what happened next? A regression to the mean. Now fast forward to 2021. It was a breakout above the upper channel line – only on steroids this time. Then look at the weekly negative divergence on the PPO. Bullish momentum was slowing. Note also that the weekly RSI remained above 50 for 18 months. All of these same conditions were present back in 2014/2015. It was history about to repeat itself. Back at the MarketVision event, I never guaranteed anyone that we would have a bear market. What I said at the time was that the RISK to the downside was too great to remain blindly long. I use technical analysis to evaluate risk, not to guarantee future price action. Those who don’t use technical analysis will always point out when it doesn’t work. But that is not the point. We use it to evaluate and manage risk. That’s it.
Those green arrows highlight “regression to the mean.” During my talk, I pointed out that, in a worst case scenario, I could see another regression to the mean, so my downside target was 3500-3800. Here’s how 2022 unfolded on this same chart:
Having this perspective BEFORE the bear market began altered the financial lives of many of our EarningsBeats.com members – in a good way. At the end of the day, everyone must make their own individual financial decisions. I always point out that we are not Registered Investment Advisors (RIAs). We’re not trying to manage anyone’s money and to do so, without the benefit of a financial plan and a risk profile, would be irresponsible on our part. Instead, EarningsBeats.com is a guidance, research, and education platform. I’d like to believe that our work helps our members make BETTER and MORE INFORMED financial decisions. That’s all we can do.
Sentiment Has Been Reset
I said in January that our absolute biggest market issue was sentiment. It wasn’t inflation. It wasn’t interest rates. It wasn’t a possible recession. Instead, everyone who wanted to buy had bought. Retail traders were EXTREMELY BULLISH and it wasn’t sustainable. I want to show you two charts of the equity-only put-call ratio ($CPCE) and then I’ll explain them:
The CPCE is a fraction, the numerator of which is the number of equity puts. The denominator represents the number of equity calls. The CPCE is a contrarian indicator. When retail traders grow bullish and are buying too many calls, the fraction (equity puts divided by equity calls) moves lower and lower. When retail traders grow more bearish, the opposite is true and the fraction rises. Over a period of time, sentiment tends to shift too far in either the bullish or bearish direction.
The first chart above simply shows us this fraction every day since the CBOE began providing us this data. Remember, the lower the reading, the more bullishness felt by retail traders. With this in mind, check out those daily readings, particularly in the second half of 2020 and throughout 2021. In the red-shaded area, there’s a cluster of readings below 0.45. This level of bullishness was hardly EVER reached in the prior 16 years. By the time 2021 ended, it was the norm. On the flip side, look at few CPCE readings above .60 in 2020 and 2021. Options traders believed the stock market was a personal ATM machine. Just buy calls and make money. Well, we now know the result of that extreme bullishness.
The second chart shows us this same data for the past 20 years. However, the readings have been smoothed out over a 253-day period, or one year. As retail traders grow more and more bullish, this 253-day moving average continues falling. But once this bullishness is exhausted, the market struggles because there are no more buyers and as the stock market falls, retail traders slowly begin to turn against the stock market and become more bearish. That’s what drives this 253-day moving average higher. This chart is as of January 8, 2022. I showed everyone at MarketVision 2022 that this 253-day moving average was just beginning to turn higher. I’ve circled in red previous periods when this moving average turns higher and the S&P 500 results while this ratio turns more and more bearish is not good. We are normally in a bear market or in a period of sideways action. This signal was telling us not to expect much bullishness in 2022. We needed a sentiment “reset”. Check out where this 253-day moving average is now and the damage inflicted on Wall Street:
I’m not sure where this 253-day moving average will top, but when it does, we’ll likely be in the midst of the “mother of all rallies”. Some might suggest that we can’t bottom until this moving average tops, but just take a look at 2016. The S&P 500 bottomed in January 2016 and ran more than 20% higher before the top occurred in the 253-day moving average of the CPCE. This isn’t a perfect science. The takeaway here for me is that the sentiment picture has completely flipped now – just as I suggested it would a year ago. Sentiment will no longer be a reason for the stock market to struggle.
Divergences Are Now Putting The Bears On Notice
I mentioned earlier that weekly PPO negative divergences at the end of 2021 suggested upside momentum was waning, another contributing factor to a potential market top. Well, like sentiment, we’ve flipped and now we’re seeing that downside momentum is waning. Check out this weekly chart:
Watch the downtrend line near 4100 and the weekly RSI 60 level. If we clear both of those, it would be pointing to further upside ahead.
The Big Picture
The long-term chart of the S&P 500 supports the notion that we’re in a secular bull market. It’s really the one chart that drives much of my secular vs. cyclical beliefs. Check this out and decide for yourself if we should ignore the long-term secular bull market thesis:
Secular bear markets have these common traits:
Monthly RSI drops to 30 or belowMonthly PPO drops well below zero lineDoes not break to all-time highs
Everyone LOVES to bet against the stock market, yet it mostly keeps going higher. There are plenty of times to be cautious and the market will typically provide us signals, as it did late in 2021 and into early 2022. Most of the time, however, betting against U.S. stocks is a worthless effort.
Things could change over the next couple months, such as inflation, interest rates, the Fed, economic concerns, etc., but I’d be careful about being overly pessimistic based on all the technical and sentiment changes that have taken place. I will review every chart that I feel is important and share it all with everyone at MarketVision 2023 on Saturday, January 7, 2023. Again, if you want to be a part of this FREE information-packed event, CLICK HERE to begin your FREE subscription to our 3x per week EB Digest newsletter.
Our Biggest Deal Of The Year Is Ending Today
Our Fall Special has been running for two weeks, but today is the last day to benefit from the lowest prices we offer all year. If you’d like to join our very satisfied group of EarningsBeats.com members, there’ll never be a better time than today. Here’s more information on our FALL SPECIAL!
Happy trading!
Tom