
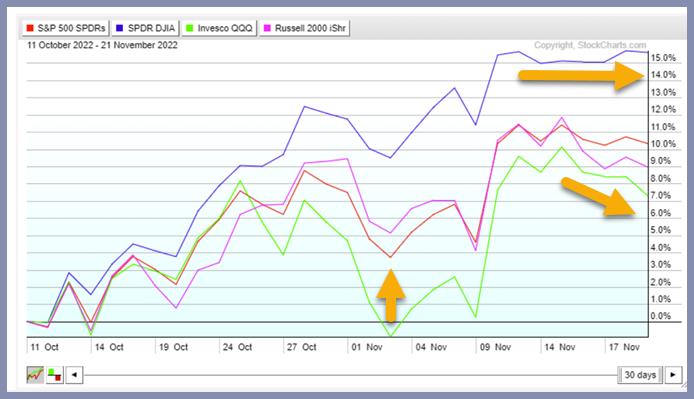
The market had a relatively quiet day as investors look to the Thanksgiving holiday. Stocks did end lower on Monday, with the QQQs declining 1.1%. DIA lost 0.06% today. As seen in the chart above, starting from October 11, 2022, the Dow Jones (represented by DIA) outperformed the other key US Indices.
In comparison to the tech heavy QQQs, which are down -29.71% year to date, DIA is only down -7.8%. Although trading volumes are often lower during a holiday-shortened week, traders should remain vigilant. Our risk gauges continue to flash caution. Consumer Staples led on Monday with a gain of 1.1%, while Utilities have gained almost 3% over the last five trading days despite a decline in risk-on sectors.
Traders should monitor volatility closely, as well as the performance of each US index, because they offer a glimpse of where things could be heading by year’s end.
DIA is down modestly from recent highs while decisively outperforming small caps and technology. It is close to taking out the previous highs of mid-August. DIA shows leadership in the Triple Play Indicator and strong momentum in the Real Motion Indicator, as shown by the green arrows above.
The Trend Strength Indicator (TSI) score for DIA is positive at 3.38, which is exceptionally high, suggesting that the current trend is robust and has more longevity. The TSI is positive and the strongest of the four equity US benchmarks. DIA also crossed the 200-week moving average in early November and is now trading sideways, consolidating recent moves.
In an inflationary climate, investing in firms with strong cash flow, pricing power, and dividends becomes more appealing and many of these companies are in the Dow Jones. Using our proprietary trading indicators, such as Real Motion and Leadership, you will be able to trade effectively, recognize trend strength and pinpoint trend leadership for effective trading in any market condition.
Rob Quinn, our Chief Strategy Consultant, can provide more information about our proprietary trading programs, our Trend Strength Indicator (TSI), and offer you a complimentary one-on-one trading consult. To find out more about Mish’s Premium trading service, click here.
Follow Mish on Twitter @marketminute for stock picks and more. Follow Mish on Instagram (mishschneider) for daily morning videos. To see updated media clips, click here.
Mish in the Media
Read Mish’s latest article for CMC Markets, titled “What’s Next For Key Sectors After the Midterms“.
Mish explains why MarketGauge loves metals and is still patiently loading up equities on Business First AM.
Mish talks metals, rates, dollar, and which sector to buy/avoid in this appearance on UBS Trending.
See Mish talk with Charles Payne on Making Money about the Oil markets testing the limits of Fed policy, China, and what to buy in the metals.
ETF Summary
S&P 500 (SPY): 392 support and 397 resistance.Russell 2000 (IWM): 179 support and 185 resistance.Dow (DIA): 334 support and 340 resistance.Nasdaq (QQQ): 278 support and 286 resistance.KRE (Regional Banks): 60 support and 66 resistance.SMH (Semiconductors): 210 support and 219 resistance.IYT (Transportation): 222 support and 228 resistance.IBB (Biotechnology): 130 support and 136 resistance.XRT (Retail): 62 support and 67 resistance.
Keith Schneider
MarketGauge.com
Chief Executive Officer
Wade Dawson
MarketGauge.com
Portfolio Manager