
I had a long discussion with a great friend today about cryptocurrencies, Decentralized Finance (DeFi), Centralized Finance (CeFi), and the exchanges that are part of the landscape. He understands way more than I do on the subject. He is an accomplished student of all the changes going on in this space. I am not. I am a passive observer of the whole thing, viewing the related charts as I do any other investment.
For me, if crypto is a trade, it is based on a trend. If the trend changes to up, I am in. If that trend changes to down, I am out with a profit or a loss. Other people have a different philosophy around it. This article is a technical analysis of what happened this week looking at the price action and what it means for the chart going forward.
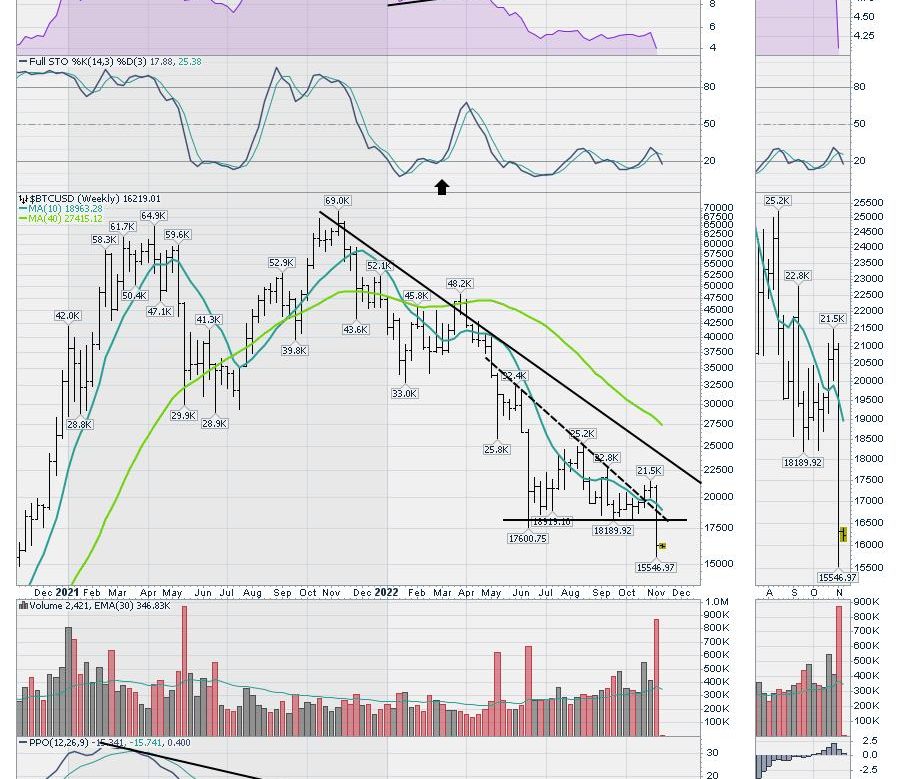
Bitcoin
It has been exactly a year since Bitcoin topped out and we can see that on the chart. The top occurred on November 10th at $68978.64 and made a new low this week on November 9th was $15546.97. A drop of 77% in exactly one year. Even the chart showing the significant fall does not explain what has happened in the space.
It shows a downtrend, but does it show that it is one of the largest 1 year asset class losses in the history of the world? While the bond markets and the equity markets have lost way more than $2T, it is the percentage of the original size of the industry that makes it so big and so fast. The Crypto market is currently worth a trillion but it was over $3T at the peak.
Of course, in the long term investors eye, it is still going to the moon because it has done that at least twice before. I think the professional question would be asked to an investor, ‘Why own it when it is going against you’? What is the benefit of being the long holding hero for something so speculative?
Chartcon 2022 Bitcoin debate
I was at Chartcon 2022 on October 9th where Dave Landry and I debated whether Bitcoin was a buy. Dave Landry, a great guy with his trend diagnosis tattooed on his arm, said it can be one of three trends. Up, down or sideways. I thought he would be talking about the longer term downtrend which I was focused on, but I was the bull for the debate. The trend was sideways for him at the time over the last 45 days. So timeframe is important when asking investors what they think about a chart.
Up, down or sideways
The difference between Dave’s timeframe and mine can be seen on the daily chart a little bit better. Bitcoin moved sideways from late August through early October at the time of the conference. There was a sudden spike up and a retreat in there as well. As the stock market was making lower lows below the June lows, Bitcoin had stabilized and did not take out the June low which was a positive if it was going to start holding better than the stock indexes.
After October 13th, the stock markets started to climb out of the hole, and Bitcoin started to move up too. The trend was starting to turn from sideways to up. That is what I wanted to see. I place a small trade in the positive direction.
But fraud doesn’t trend well. As FTX hit the news, the chart collapsed, losing 30% in a few days. Volume soared. Some investors are still holding. Investors like me are out. The reach of FTX across the industry was not something I was aware of. I spoke with my friend and sold the position. Out with a loss.
Now the next question comes to the fore. When to get back in? What about buying this low with huge volume that looks capitulatory?
In the cryptocurrency space, there have been other spectacular collapses and there will be more.
Luna, Solana, Dogecoin, and many others have ridden the wave of attention to this asset class only to put a dagger in those willing to be involved. The Mt Gox exchange blew up back in 2014. But the new one this week was FTX.
FTX collapse
Let’s examine a little more than the chart here because I think there is one piece of news that changed this time.
FTX was supposed to be an institutional level service to help them manage various coins. In the first look inside after the collapse, it was a deceptive plan. Taking money/assets in and using it for other purposes like trading. Bernie Madoff would pay withdrawals with new customer funds. Enron would use off balance sheet tools. Fraud has no boundaries and it would appear that is what happened here.
The real problem for institutions that want to invest in crypto related offerings, is they have a fiduciary duty to manage client assets and the FTX exchange was a ‘solution’ for that. Without getting into all the people who supported crypto related investing, it had big minds on both sides. Investing through FTX was supposed to be the institutional level. This has gone away.
So the real problem is: Until institutions can meet this fiduciary responsibility, it is going to be hard for them to invest in the space. Without institutional level investors, the retail public can slosh around, but trying to build a new uptrend is akin to trying to raise the level of a lake with a 1 gallon jug. Not going to happen.
On top of that, investors like Cathie Wood’s ARK funds have been investing in leading edge, some would say bleeding edge, technology. While Cathie’s ARK has long since sailed, some of her investments have had a rough track record from day one. One in this space was Coinbase.
Coinbase
COIN IPO’d to spectacular attention, as the VC’s behind it were willing to feed the euphoric appetite of 2021’s next generation of new investors with exciting new offerings. The stock topped on the first day of trading at $429.54 and the low in May was more than 90% off the high. The new spike down this week was just short of a 90% discount off the high.
Microstrategy
Microstrategy (MSTR) is another way to ride the wave related to this asset. The chart looks eerily similar to every other boom / bust idea. The CEO still says it is a good idea. We need at least a 400% move to get near last years high but we lost 36% this week!
BOOM/ BUST Ideas
So here are some other great ideas that went on a run. They might help formulate an investment decision.
TLRY
Tilray in Marijuana. The CEO said the market cap would be $100 Billion and climbing.
NIO
Nio, the Chinese electric SUV maker in EV’s.
SPCE
Virgin Galactic in space exploration.
LOCK
These are the charts of the ‘Loss Of Capital Kings’ or LOCK for short. The investor belief is locked in and it continues to be wonderful until it is thoroughly washed away.
The ETF’s that overlay those investments have chart patterns like ARKK.
If they bounce, they can be a great trade. So rare are the right picks for the next decade. Many times a stock pick for the next three months can lose money. While these trends can last for a period of time, most investors can’t sell at the top. Owning the stock is the best story told at the bar, on the golf course, at the dinner table, at the car dealership, or at the office. They become so attached they rarely have a sell formula to protect the gains. They might get a second mortgage on the way down as the price is a real bargain now.
Long-term investing like a ‘modern fool’ (I might have spelt that first word wrong) for the next 10 years is a dangerous way to protect capital. If an investor becomes so secure in the belief that the CEO will tell them when things are going badly before the chart breaks, that investor will need a lot more investing help. Charts like Tilray are an example where the CEO has never said sell the stock. Elon sold Tesla stock within a week of the top but was just taking a little off the table.
Whether it is Block (SQ), ShakeShack (SHAK), or Plug Power (PLUG), trading parabolic charts on the down side is way harder than the upside. If this is the next great setup, an investor should buy it with a stop and be prepared to lose the difference between the buy point and the stop. Otherwise, the investor will have a short investing career.
This article is technical analysis of what happened this week based on the price action of Bitcoin and related cryptocurrency trades. What does it mean for the chart going forward? We didn’t talk about tokens, or Defi or Cefi, or wallets or technology. The chart is an investors friend and it is in a downtrend. Until that changes, I want to let someone else own it.