
While gold has not done much in 2022 in terms of absolute returns, the GLD has indeed outperformed the SPY by about 11% year-to-date. Why has gold not done better as a safe haven? It’s all about the US Dollar.
First, let’s review gold’s role as a “safe haven” during bear market phases.
While gold has struggled in absolute terms, it has handily outperformed the S&P 500 index year-to-date. The GLD is down about 4% in 2022, while the SPY is down 15% over the same time period.
If you had informed me at the end of 2021 that 2022 was going to be a raging bear market for stocks due to concerns about inflation, I would have told you that one of surest bets would be gold. Gold is often considered one of the best inflation hedges around! So why has gold not been a better safe haven while equities have been in a consistent bear market phase in 2022? Quite simply, the strength in the US Dollar has prevented gold from fulfilling this traditional role.
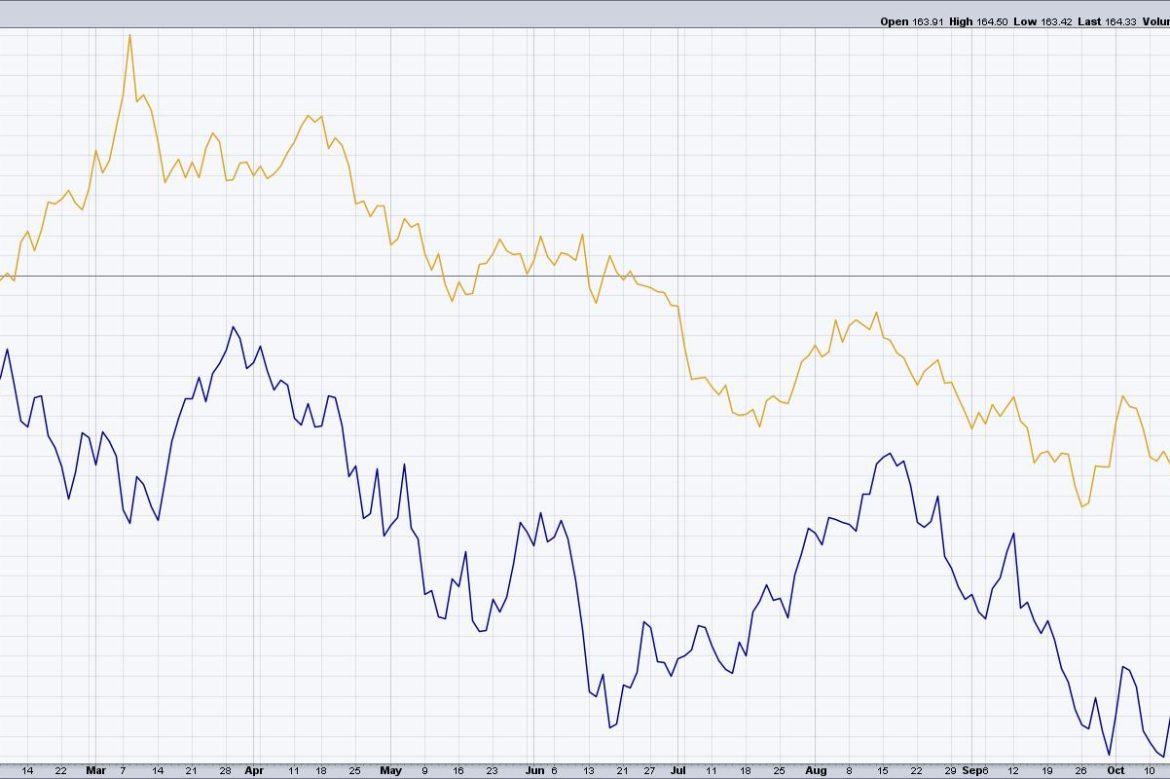
Every month in 2022, the US Dollar has made a new high for the year… until October. The $USD has now made a pattern of lower highs and lower lows over the last six to eight weeks, indicating a potential change in trend. The RSI for the US Dollar has now dipped below the 40 level for one the second time in 2022. This move below RSI 40 may indicate a “change of character” from a bullish primary trend to a bearish primary trend. This short-term weakness in the US Dollar has provided space for risk assets like equities and commodities to reverse their recent downtrends and push to the upside. Further weakness in $USD would allow risk assets including commodities to push higher.
For now, I’m watching the 105 level for the US Dollar. That represents a 38.2% retracement of the May 2021-September 2022 uptrend and would be a reasonable downside objective given the recent weakness.
So what’s next for gold?
As the RSI for the US Dollar has dipped below 40, indicating a new bearish phase is likely, the RSI for gold has pushed above the 60 level after spending most of 2022 below this level. That suggests a bullish primary trend as upside momentum has expanded.
The next upside target for GLD, using Fibonacci retracements, would be around $167, which is just 1.5% above Friday’s close. The 200-day moving average lies just above that level as well. If those resistance levels are violated, we could see further upside to the 61.8% retracement level around $177.
In terms of spot gold, that would suggest resistance in the $1800 range, with the next upside target around $1900/oz.
2022 through October has been all about rising interest rates, a stronger dollar, and falling risk assets. If the seasonal tendencies hold up going into year end, we may be facing a bullish run with gold in the driver’s seat!
Want to digest this article in video format? Head over to my YouTube channel.
RR#6,
Dave
P.S. Ready to upgrade your investment process? Check out my YouTube channel!
David Keller, CMT
Chief Market Strategist
StockCharts.com
Disclaimer: This blog is for educational purposes only and should not be construed as financial advice. The ideas and strategies should never be used without first assessing your own personal and financial situation, or without consulting a financial professional.
The author does not have a position in mentioned securities at the time of publication. Any opinions expressed herein are solely those of the author, and do not in any way represent the views or opinions of any other person or entity.