
Week Ahead: With A Holiday In Between, NIFTY May Largely Extend Its Gains; These Sectors May Stay Strong
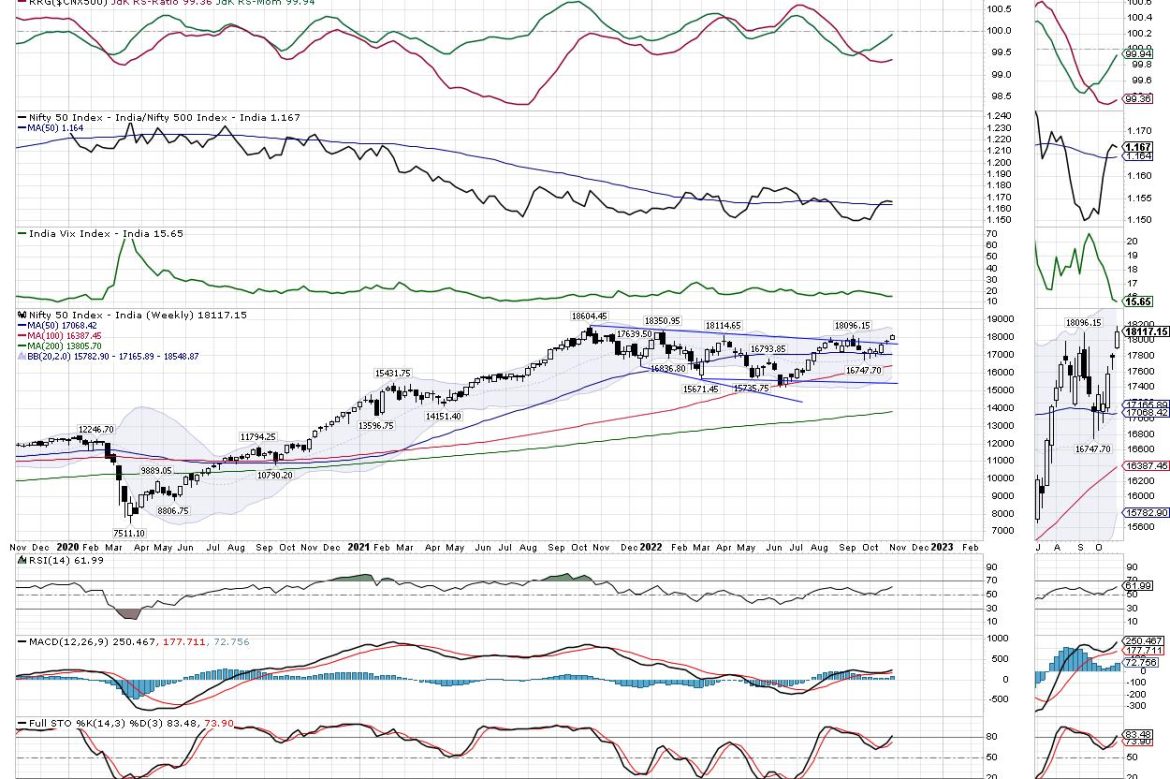
In a week that remained pretty much buoyant, the equity markets continued with their up move as they added to their gains; in the process, they also confirmed the breakout above the all-important falling trend line pattern resistance on the higher time frame charts. The markets stayed generally buoyant over the past sessions and went on to add and extend their gains. In the process, they have dragged their support levels higher. The trading range stayed narrow; the NIFTY oscillated 278.85 points before ending with net gains of 330.35 points (+1.86%) on a weekly basis.
The coming is once again a truncated one; Tuesday is a trading holiday for the markets. From a technical perspective, a breakout above the falling trend line stands confirmed; the NIFTY has dragged the supports higher to 17700-17850 levels in the process. The Banknifty is still severely consolidating just below the high point; there are greater chances that it catches up given its relative underperformance over the past several days. Volatility declined; INDIAVIX came off by 1.68% to 15.65. The most immediate levels to watch for the NIFTY would be the 18350-18500 zone over the coming days.
Given the strong global trade setup, the Indian markets are also likely to see a stable and strong start to the week. The levels of 18350 and 18550 are likely to act as potential resistance points. The supports come in at 17910 and 17480 levels.
The weekly RSI is 61.98; it has marked a new 14-period high which is bullish. RSI remains neutral and does not show any divergence against the price. The weekly MACD is bullish and trades above the signal line. The widening of the Histogram represents incremental momentum in the up move.
The pattern analysis shows that the breakout that happened following the penetration of the falling trend line has sustained itself as of now. This falling trend line begins from the lifetime high of 18600 and it joins the subsequent lower tops.
Given the technical structure of the charts, there are possibilities that the NIFTY may inch higher towards the 18350-18400 levels where it is likely to face some resistance again. Broadly speaking, the markets may continue to stay stock-specific in nature, but we may see some improved performance from the financial services stocks and banks if the Banknifty attempts to play catchup. In any case, the volatility may be seen as the markets have a trading holiday on Tuesday; after that when it opens again, it will adjust itself to the global trade setup. It is strongly recommended that one must avoid creating major shorts in the market as some upside room is evidently seen on the charts. While staying stock-specific in approach, leveraged positions must be kept at modest levels. A cautiously positive outlook is advised for the coming week.
Sector Analysis for the coming week
In our look at Relative Rotation Graphs®, we compared various sectors against CNX500 (NIFTY 500 Index), which represents over 95% of the free float market cap of all the stocks listed.
The analysis of Relative Rotation Graphs (RRG) shows continued strength in the Metal and PSU Bank Indexes that are currently inside the leading quadrant. NIFTY Bank Index is also inside the leading quadrant but looks faltering on its relative momentum against the broader markets. However, these pockets may show relative outperformance against the broader NIFTY500 Index.
The Financial Services Index and Midcap Index have slipped inside the weakening quadrant. The FMCG, Consumption, and Auto index are also inside the weakening quadrant.
NIFTY Realty is seen languishing inside the lagging quadrant and may relatively underperform the general markets along with the Energy Index.
NIFTY Commodities, IT, Infrastructure, Pharma, PSE, and Media Indices are inside the improving quadrant; they may continue showing stock-specific outperformance against the broader markets.
Important Note: RRG™ charts show the relative strength and momentum for a group of stocks. In the above Chart, they show relative performance against NIFTY500 Index (Broader Markets) and should not be used directly as buy or sell signals.
Milan Vaishnav, CMT, MSTA
Consulting Technical Analyst