
It has been a wonderful rally off the lows. In under two weeks the commentary has gone from extremely bearish to the best month in 40 years. That is a wonderful change in commentary. If you weren’t ready for this rally, you might be interested in this video I recorded earlier this week. Osprey Strategic October Review.
I will say its been a choppy period depending on what you bought. Tech names thrashing about with the mega caps having massive swings on earnings. Who would have picked the markets to be having a strong month with the mega-caps imploding? I definitely did not expect the results from those names to be so negative.
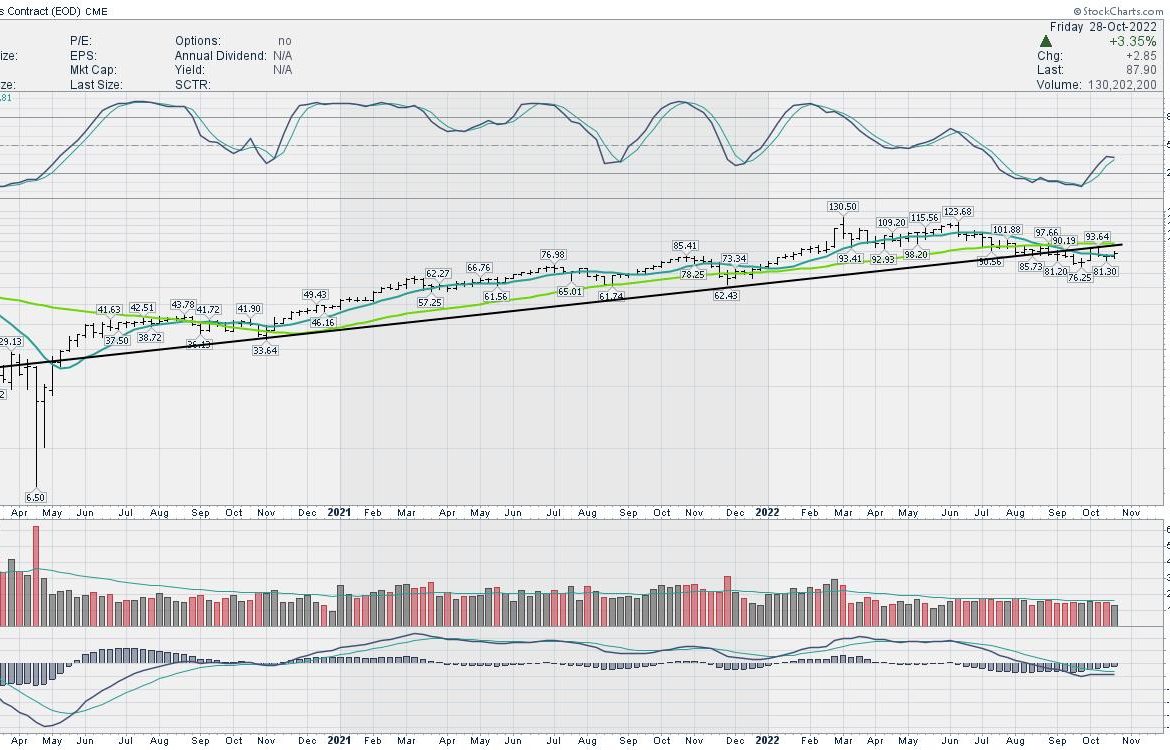
Oil names have been doing great. I am a little concerned that the oil names might top here as the weekly PPO for crude oil is right near zero.
I need it to turn up soon to keep a bullish thesis.
This chart of XOP – the oil production ETF reversed on Thursday after taking out the prior highs. I love the inventory backdrop for oil, but it has to be mapped against the potential for a recession. I am reminded of 2008 and always wary, as I live in a city with commodities as a strong indicator of the local economy.
Let me talk about the potential for a recession and examine if that is well in the rear view mirror already. Is it priced into the equity markets and we just go higher from here?
Home sales
When I look at the home sales, this has the look of 2006-2010 but it also happened during other recessions. It dropped for the 1980-1982 recession and the 1990 recession. It did not drop in 2000-2002 (missed that cycle) but had a drop of doom in 2006-2010. This chart should update soon with another big drop. Look at the PPO indicator in the middle when it drops below zero. Those negative periods on housing sales were also broad economic recessions. It suggests being careful.
The Fed Funds Rate chart
The top panel is the fed funds rate and it is widely accepted it will be going up 0.75% on November 3rd and potentially another 0.5% on December 15th as we come to the end of October. In the next 7 weeks we’ll see a move of 1.25% which is an additional 500% move from where we started the year (0.25%). Let’s just think about this for a minute.
In the middle panel is the PPO momentum indicator. Notice how the swings are bigger on the right than on the left.
I am reminded of my trip to the Oakville research centre in Oakville, Ontario, Canada in 1988 where we tested new motor oil additives for unique things like low temperature startup, holding dirt and metal filings in the oil to take it to the filter, breaking up water molecules that bonded together to stop rust, detergents to clean the engine, and long run continuous operation tests with no shutdown. Some of the additives created in these labs became commercial products. They were good and a number of engines ran a million miles with regular oil changes and maintenance of the bearings. Those were the success stories.
But there were other additives that didn’t work. The motors are running on stands in concrete rooms. A few walls had big holes in them. Why would that be?
If the additive had problems, wear would start to build heat. Heat in the bearings would create more wear, creating more friction and eventually the crankshaft got out of balance with uneven friction. It would overheat and eventually something would fail. The parts could fall into the engine pan and destroy everything else while it continued to try and spin or it could send the piston flying through the block and it would hit the wall with huge force. Call it a failed test.
It would overheat and eventually something would fail
When I look at the PPO in the middle, I can’t help but notice how the momentum swings in the interest rate cycle are bigger with more force both ways (positive and negative). As the Fed tests additives to the economic engine, it is creating bigger swings both ways using modern economic theory models. Some were tested in other countries before they used them on the US economy. Some were created and thrown in to see if they would work in real time.
When I look at the rate of change indicator on the lower panel, it is going to surge another 500% above where it already is and it usually takes about a year for fed policy to filter into the economy. This is a moon shot by any description that started 10 months ago.
That is going to translate to an even more massive surge on the PPO in the middle. Let me get mathematical for two sentences. The PPO settings are 12 months and 26 months (The signal line is the 9 month number). So the first number is still accelerating as we are 10 months in with further increases in the next two months and the second number is about 35% (10 months) through the 26 month setting. All that to say, this is a moonshot into space for the momentum of changing interest rates.
Day after day we hear of senior people leading the financial industry – one would be Jamie Dimon – warned that a “very, very serious” mix of headwinds was likely to tip both the U.S. and global economy into recession by the middle of next year. The stock ripped higher by 25% since he said it! That makes investing very, very, hard!
“very, very serious” mix of headwinds
Staying on the chart above, when I look at the rate of change on the lower panel in Fed funds between 2014 and 2018, the move in 1016 was well above – about 50% more – than the 2005 high. Now it looks like it was a ripple on a coffee cup but at the time it was huge. During that period, the PPO moved all the way to the top side of the range over 4 years. We don’t know the effects of this current test using this new one-year-rate-of-change-additive but we are forcing through a massive rate of change in one year. Looking at the 40 year expanding wobble on the PPO momentum indicator and the ‘we won’t have another economic event in my lifetime’ rate of change indicator, it’s hard to imagine this doesn’t heat up the bearings or worse, throw a piston through the block of the economy, slamming it to a halt. This interview today from the Treasury Secretary – I don’t see a recession on the horizon.
I don’t have any way of knowing what the future will bring, but it is fair to say it has the potential to unleash something we haven’t seen in a 1/2 century. I don’t know if economic cycle models will work. I don’t know if commodity cycles can override the effects of these monetary cycles. I only know what I can see today and compare that to history.
My macro work is very effective for finding entries and exits for the stock market . Is it perfect? No. But it won’t miss big changes for more than a week or two. Being blindsided by big moves down is way more dangerous than the gains on the way up. The market can always climb a wall of fear, but for me it is important to protect my capital religiously so when the bottom does come, we can make some real gains.
We are up a heady 14% on the Dow 30 in 2 weeks and I have enjoyed the ride. The $INDU chart is back at the 40 week moving average (WMA). The Nasdaq 100 chart has lots of room to run to get to the 40 WMA. How high will it go?
Each stock market wave in a bear market gets bigger both ways. As we roll thru the 4th quarter with another massive Fed Funds rate increase designed to slow the economy, I want to be very aware of the changing tide of investors. I plan on making money for the rides up, and sitting aside for the ride down. Again, I’d encourage you to watch the video as it discusses the October low and investing around it.
October – Osprey Strategic Market Approach
Clues from the commodity charts are hanging on the edge. A presentation I did in Calgary on October 15th carried a theme about driving along the cliff, hoping we don’t have a James Dean moment. In the meantime, I am invested.
I reviewed the oil chart on the Your Daily Five video today along with some other critical charts right now.
Your Daily Five
To summarize, the rallies in bear markets are there to get us all bulled up. I want to participate in those. Then comes a rug pull that wipes out our capital. Right now we know there is friction ahead. We just don’t know ahead of time when the market will stop rallying into it or if it will stop rallying. Investing is hard work and investing with a smooth running engine is preferable. We don’t have that right now, but we can still make money if we stay focused on price action. I am happy to have made some gains to wrap up the month and I’ll be equally happy to protect the portfolio should the time come.
Stay cautious!