SPX Monitoring Purposes: Long SPX on 10/10/22 at 3612.39; sold 12/13/22 at 3669.91 = gain 1.59%.
Monitoring Purposes GOLD: Long GDX on 10/9/20 at 40.78.
Long Term SPX Monitor Purposes: Neutral.
The above chart is the “National Association of Active Investment Managers”, a.k.a. NAAIM. Intermediate-term lows have formed when NAAIM reached 20 or lower. On October 3, the low came in at 12.61, and the current reading stands at 20 even. This is another sentiment reading that suggests the market is building a base near current levels.
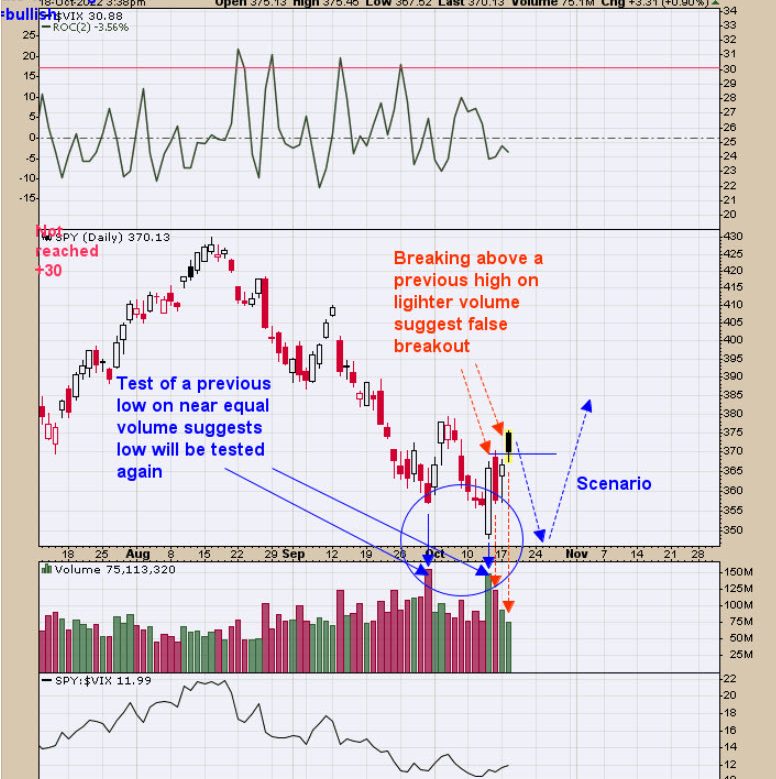
Above is a volume study on the SPY over the last couple of weeks. The September 30 low was tested October 13 on near-equal volume, and things suggest the October 13 low will be tested again. Today’s trading broke above the previous high of October 14 on at least 10% lighter volume, suggesting a false breakout to the upside. If a market can break above a previous high on near equal volume, it may reverse and attempt to take out the previous low; in this case, the previous low is the October 13. SPY could be forming a “Three Drives to a Bottom” pattern, which suggests another new low is possible that may finish the base building process. Yesterday, we said “We do think a rally is coming, but our view is that it may falter at the August high near 430 SPY and that the Summation index on that rally may not reach +1000.” This will be important to remember if indeed the 430 SPY is reached.
We posted a chart like this previously, but here we zoomed in to show the divergences more clearly. The top window is the cumulative GDX up down volume percent, the bottom window is the cumulative GDX Advance/Decline percent and the middle window is the GDX. What we want to point out is that Up Down Volume percent has made higher highs and higher lows while GDX has made lower highs and lower lows, which is a bullish divergence. The cumulative advance/Decline (bottom window) has done the same thing. Both indicators suggest the internals for GDX are getting stronger, a bullish sign. The gold market could remain calm going into the election, but then, after the election, show strength.
Tim Ord,
Editor
www.ord-oracle.com. Book release “The Secret Science of Price and Volume” by Timothy Ord, buy at www.Amazon.com.
Signals are provided as general information only and are not investment recommendations. You are responsible for your own investment decisions. Past performance does not guarantee future performance. Opinions are based on historical research and data believed reliable, there is no guarantee results will be profitable. Not responsible for errors or omissions. I may invest in the vehicles mentioned above.

