
On Thursday, the S&P 500 index opened around 3500, which is a fairly significant level. That price point represents a 50% retracement of the 2020-2022 bull market phase.
Was I surprised to see a bounce off the 50% retracement level? Absolutely not. As Katie Stockton shared on The Final Bar this week, it would actually be surprising if the major averages had not bounced higher off this level.
After gapping lower at Thursday’s open, we saw a quick acceleration to the upside. Thursday’s rally pushed the S&P 500 right back above 3600, causing many investors to announce their renewed optimism in a broad market recovery.
But what a difference a day makes…
Super excited to announce our upcoming FREE webcast from Market Misbehavior called The Market Bottom Checklist Revisited, coming up on Tuesday, October 18th at 1pm ET.
Back in June, we revealed our Market Bottom Checklist including ten key items to track as the markets move lower. This time, we’ll revisit those ten guideposts, reflect on the current market conditions and relate it all to the seasonal strength likely to occur in November and December.
Sign up HERE and don’t miss our latest free webcast!
Friday began with a gap higher and the S&P 500 briefly teasing the 3700 level. But, through the course of the day, stocks were moving steadily lower. Many charts had rotated from a bullish candle pattern to a bearish candle pattern.
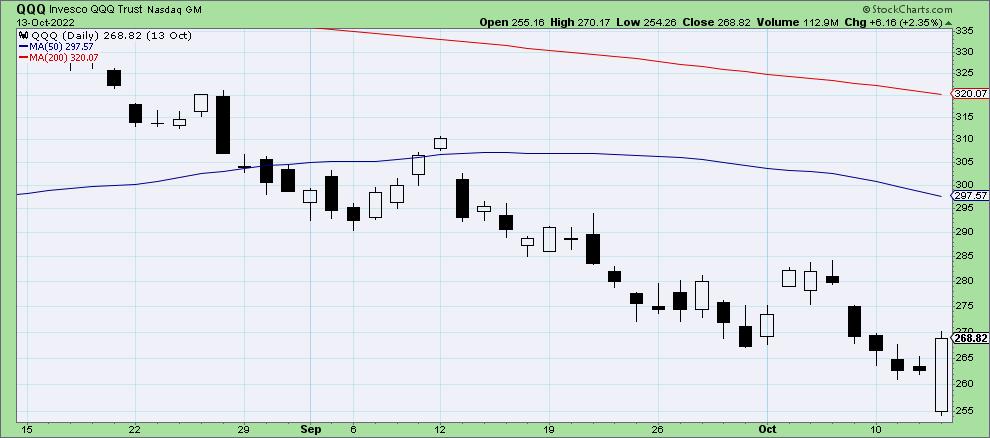
Here’s the QQQ after Thursday’s session:
Note how the most recent candle’s body “engulfs” the open-close range of the first candle? There’s the bullish engulfing pattern, which indicates a strong likelihood of further upside.
But after Friday’s selloff, the charts looked like this:
Now we have the dreaded “dark cloud cover” pattern, where we have a big up day followed by a big down day. Day two does not go below the first day’s open, but it does reach at least 50% of the way down the real body of day one.
Note to candle purists: Is this pattern really more important when it happens in an uptrend? Absolutely. But for me, Friday’s candle shows a severe lack of follow-through from Thursday’s rally, and that’s what’s most important here.
So instead of the markets finishing this week with a bullish exclamation point, a strong up day announcing to investors, “Yes! We are now in a bullish phase!!”, we instead have the major averages whimpering into the weekend in a position of weakness.
And this happened all over the place with individual equities. Here’s the chart of TSLA.
In this case, we have a bearish engulfing pattern, where the second day’s candle completely engulfs the real body of the first day’s candle. So all the optimism shown for TSLA on Thursday was unwound — and then some. And if you think the action of mega cap stocks don’t have an incredibly large impact on our major benchmarks, think again!
Another note to candle purists: Would this be a more ideal candle pattern if it happened during a raging uptrend? Of course. But as we mentioned above, the key here is the lack of follow-through after Thursday’s rally.
So where does Friday’s session leave the stock market as we prepare for next week?
My “Wrap the Week” chart (which I feature every Friday on The Final Bar) shows a familiar pattern, with the US Dollar finishing the week in the positive while literally all the other major asset classes are in the negative. That’s right, the Dollar has once again earned its moniker as “the wrecking ball for risk assets”.
Can the market rally next week? Absolutely. Anything is possible. But given Thursday’s inflation numbers and Friday’s selloff, I would tend to follow the guidance of my Market Trend Model, which tells me to focus more on capital preservation over capital growth. Now is the time to remain vigilant, to focus on risk management, and to keep a wary eye open for telltale signs of a market bottom!
RR#6,
Dave
P.S. Ready to upgrade your investment process? Check out my YouTube channel!
David Keller, CMT
Chief Market Strategist
StockCharts.com
Disclaimer: This blog is for educational purposes only and should not be construed as financial advice. The ideas and strategies should never be used without first assessing your own personal and financial situation, or without consulting a financial professional.
The author does not have a position in mentioned securities at the time of publication. Any opinions expressed herein are solely those of the author, and do not in any way represent the views or opinions of any other person or entity.