
Week Ahead: Stability In Global Equity Markets A Must For A Technical Pullback; NIFTY Continues To Defend Key Support Levels
Despite the scale of volatility represented by gaps over the previous days, the NIFTY has by and large maintained its crucial support levels on the weekly charts. The previous technical note mentioned how the Index has created and maintained its crucial support; it managed to keep its head above these important levels over the previous week as well. The Index kept its head above the 50-Week MA and spent the week oscillating in a 398.25-point range which was narrower than the week before this one. While the markets did not violate any major support levels, they still ended on a negative note as they closed with a net loss of 128.95 points (-0.74%) on a weekly basis.
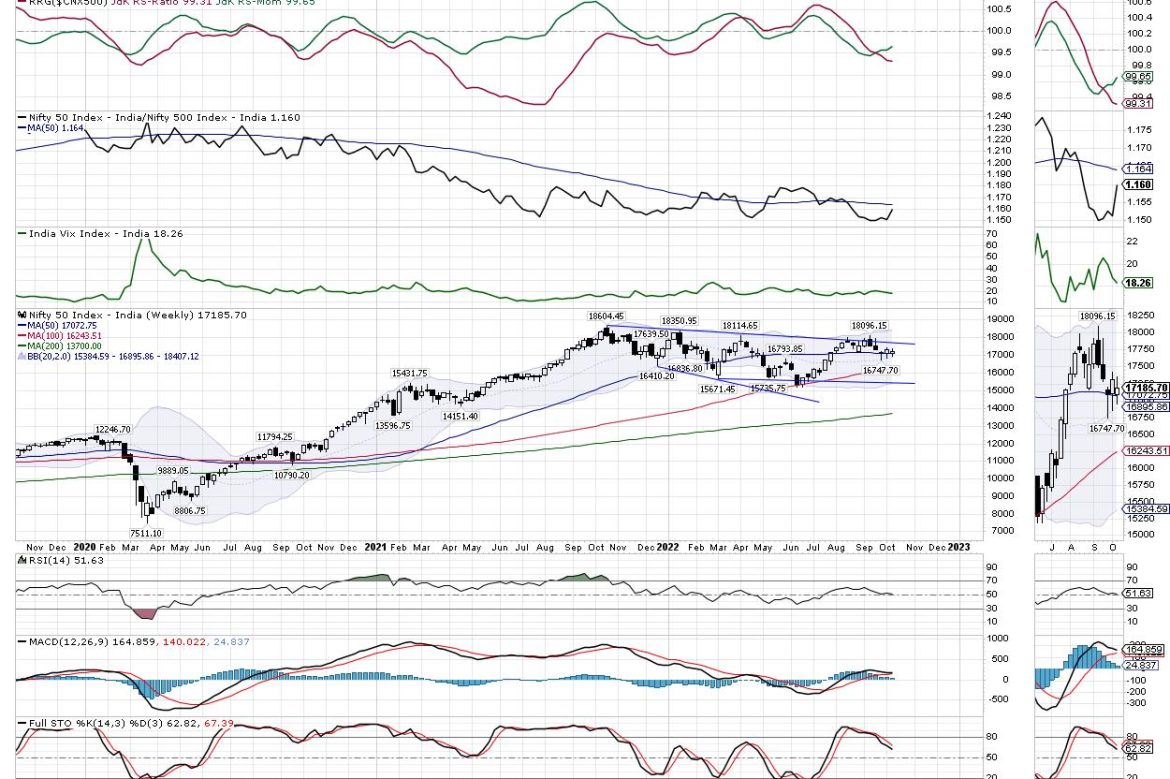
A close examination of the weekly and daily charts shows that the markets have created multiple support zones for themselves. On the daily chart, the Index has defended the important support level of 200-DMA which is placed at 16987. This level is very close to the 20-Period Weekly MA which is at 16895. The 50-Week MA is presently at 17074. All this collectively makes the zone of 16900 to 17100 a crucial support zone for the NIFTY. So long as the Index can keep its head above 16900, there are better chances of the markets gathering strength through some consolidation. Any slip below 16900 on a closing basis would invite incremental weakness in the markets.
Volatility decreased a bit; INDIAVIX came off by 2.95% to 18.26. The coming week is likely to see the levels of 17300 and 17480 acting as resistance; the supports are likely to come in at 17000 and 16840 levels.
The weekly RSI is 51.63; it stays neutral and does not show any divergence against the price. The weekly MACD is bullish and remains above the signal line; however, the narrowing slope of the Histogram is a slight concern which shows the deceleration of upward momentum in the short term. This is also a formation of an “Inside Bar”; this means that the current bar has a lower high and higher low as compared to the previous bar. This indicates the indecisiveness of the market participants and also represents consolidation in a narrow range.
All in all, the level of 16900 is something that needs to be closely watched. The NIFTY has created a strong support zone between 16900 and 17100 levels in form of the 20-Week MA, 50-Week MA, and 200-Day MA; so long as the Index stays above this zone, there are fewer chances of structural damage on the charts. It would also be critically important to watch the behavior of the US Markets; the S&P500 index has not only taken support on the 200-Week MA, but it has also shown a strong bullish divergence of the RSI against the price. If we see signs of stability and some technical pullback in the US markets, we will also see some strong short covering taking place in the domestic markets as well. The reason behind this is the strong relative strength of NIFTY against the S&P500.
It is strongly recommended that so long as the markets are consolidating, all fresh purchases must be kept limited to defensive pockets and in stocks that are seeing improvement in their relative strength. While keeping leveraged positions at modest levels, a cautiously positive approach is advised for the day.
Sector Analysis for the coming week
In our look at Relative Rotation Graphs®, we compared various sectors against CNX500 (NIFTY 500 Index), which represents over 95% of the free float market cap of all the stocks listed.
The analysis of Relative Rotation Graphs (RRG) shows while being placed in the leading quadrant, the NIFTY Midcap and Financial Services Index is seen sharply giving up on their relative momentum against the broader markets. Besides this, NIFTY PSU Bank and Banknifty are also placed inside the leading quadrant and are expected to relatively outperform the broader markets.
NIFTY Consumption and FMCG indexes are inside the weakening quadrant; however, they appear to be mildly improving on their relative momentum. The NIFTY Auto Index is also placed inside the weakening quadrant.
The NIFTY Realty Index has rolled inside the lagging quadrant and it is likely to relatively underperform the broader NIFTY500 Index and so is the NIFTY Energy Index which is also placed inside the lagging quadrant. The NIFTY Pharma and Infrastructure Index are also inside the lagging quadrant but they are seen improving on their relative momentum.
The NIFTY PSE Index has rolled inside the improving quadrant. Besides this, Metal, Media, and IT Indexes are also inside the improving quadrant.
Important Note: RRG™ charts show the relative strength and momentum for a group of stocks. In the above Chart, they show relative performance against NIFTY500 Index (Broader Markets) and should not be used directly as buy or sell signals.
Milan Vaishnav, CMT, MSTA
Consulting Technical Analyst