
Are stocks in a bull market phase at the moment?
Well, that certainly depends on where you’re looking. If you’re analyzing the Nasdaq 100 index, or semiconductors, or AAPL, or NFLX, or a handful of other mega-cap growth names, then that is basically an undeniable truth at this point. If you’re looking at energy stocks, or the financial sector, or the equal-weighted S&P 500, or to be completely honest most US stocks at this point, then that answer is a little tougher to justify.
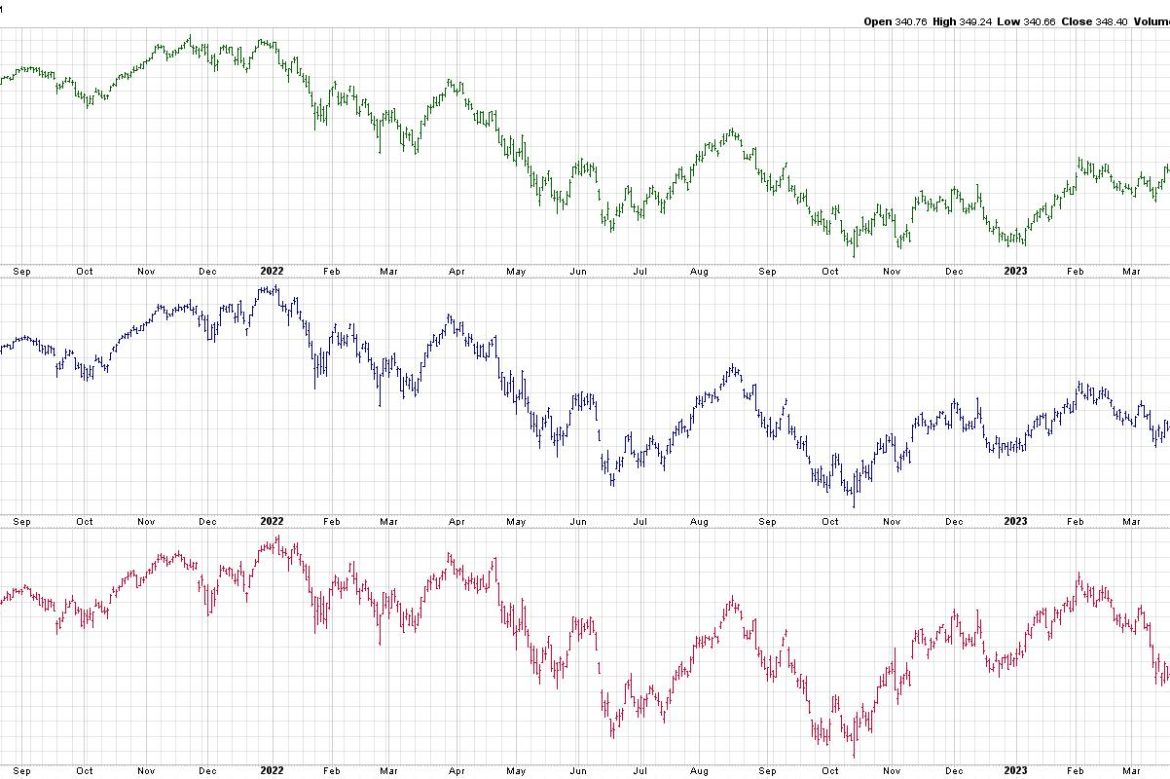
So how much of a problem is it that this “narrow leadership” issue we’ve discussed frequently on The Final Bar continues to plague the equity markets as we near the end of May 2023? That depends on what you own during this narrowly-led bull market phase!
If you’re in the Nasdaq 100 (top panel, black) names like MSFT and AAPL, you’re seeing another strong up week. You’ve experienced a new high every month so far in 2023, including May. The trend is your friend, and that trend is clearly bullish!
If you own the S&P 500 index (middle panel, blue), you’re probably feeling cautiously confident at this point, with another test of the February highs working this last week. Although previous attempts to push above S&P 4200 have failed, the rally through the course of this week most likely lets you head into the holiday weekend with renewed optimism.
What about if you own the “average” S&P 500 stock, as represented by RSP, the equal-weighted S&P 500 ETF (bottom panel, red)? Now you’re thinking less about the February highs and more about the March lows, which are still very much in play.
And it’s not just the S&P 500 index having this “lack of participation” issue. Here are the cumulative advance-decline lines for the NYSE, large caps, mid caps, and small caps.
Note how, while the S&P 500 has been trending higher over the last six weeks, literally all four of those advance-decline lines are sloping lower. If the A-D lines are the real representation of the market trend, an argument that we find has great value these days, then this may be in fact a clear bear market phase! Yet the averages keep pushing onward and ever upward.
To add fuel to the bullish fire, we have the New Dow Theory chart very close to signaling a “bull confirmation” signal. We would need to see an upside follow-through next week to complete the pattern, but the setup so far seems constructive.
Charts like Netflix (NFLX) keep pushing above key resistance levels, indicating that additional buyers are coming in and providing further upside momentum. And with Consumer Staples stocks pulling back from their own resistance levels, the offense-defense ratio appears to be rotating clearly to the offensive side.
My biggest concern for this market? Limited upside from current levels. There are indeed two ways that this market resolves from here.
The first option is that breadth conditions improve, with beaten-down names that have yet to be participating in the upswing start regaining their ground. There are more 52-week highs to be had and charts like the McClellan Oscillator get out of the “bearish” region by breaking back above the zero level.
The second option is that the influx of demand for growth stocks pushes prices to unsustainable levels, as the FOMO-led AI craze evaporates, the music stops, and the lack of breadth support finally becomes the death knell for the great bull market of early 2023.
What’s the good news?
If the bullish option plays out, there will be plenty of buying opportunities. While it feels like you may have missed out on the biggest bull run in stock market history, things may just be getting started. Watch for breakouts, set price alert, run your scans, and you will find charts that are at actionable entry points.
If the bearish option plays out, then the charts will tell you when the uptrend in growth stocks has run its course. Watch indicators like RSI for bearish divergences, use something like MACD or PPO to confirm a downside rotation, and stick with uptrends until the chart tells you the uptrend is done.
I asked our three panelists on The Pitch this week (thanks again to Dave Landry, Mark Newton, and Joe Rabil!) how they manage to survive challenging periods like this. I thought Mark’s response was as good as I’ve heard.
“Well, I try to surround myself with charts rather than news.”
Well said, Mark.
Our latest YouTube video digs into the chart of Netflix, tracking the latest breakout and using RSI and Fibonacci Retracements to identify potential resistance levels. Check it out!
RR#6,
Dave
P.S. Ready to upgrade your investment process? Check out my free behavioral investing course!
David Keller, CMT
Chief Market Strategist
StockCharts.com
Disclaimer: This blog is for educational purposes only and should not be construed as financial advice. The ideas and strategies should never be used without first assessing your own personal and financial situation, or without consulting a financial professional.
The author does not have a position in mentioned securities at the time of publication. Any opinions expressed herein are solely those of the author and do not in any way represent the views or opinions of any other person or entity.