
At the Edge of Chaos: The Fed Will Raise Rates — But By How Much? And How Will the Market Respond?
The stock market is pricing in a “pivot” of some sort from the Fed. This is a risky bet, especially in a poor liquidity environment.
And if you’re having a flash of déjà vu, that’s because this rally looks a lot like the summer rally. On the other hand, we are entering the strong seasonal November to January period for stocks, a fact that could favor an extension of what may turn out to be just another bear market rally. Still, in the short term, the fate of this rally is in the hands of what comes out of the November FOMC meeting and the next CPI.
What We Know
The stock market has been rallying since the Fed’s apparent leak to The Wall Street Journal a couple of weeks ago that it would raise rates by 0.75% in November and likely follow with a 0.50% increase in December. Moreover, since the Fed’s perceived “pause” pre-announcement, the Bank of Canada raised rates less than expected, and the European Central Bank (ECB) raised its rates by the expected 0.75 basis points while promising to raise rates further on a “meeting to meeting” basis based on data.
What the Market Expects
The stock market has priced in somewhere around a 90% chance of a 0.75 basis point rate increase, as measured by the CME Fed Watch Tool. The market will be looking for confirmation that the Fed will at least consider a pause, or a reduction in the pace and breadth of future rate increases. And since there is no press conference after this meeting, the central bank’s post meeting statement will be crucial reading.
Where the Fed Is at the Moment
The U.S. central bank is between a rock and a hard place. Many have questioned their independence – their “credibility” is on the line.
Pressure is building on the Fed, with JP Morgan CEO Jamie Dimon recently stating that the Fed is making it difficult to run trading desks under the current situation. Meanwhile, at least two senators, Sherrod Brown (Ohio, D), Chair of the Senate’s Banking Committee, and John Hickenlooper (Colorado, D), have publicly called for the Fed to stop raising rates. Unconfirmed rumors are floating about that the White House has voiced its displeasure with the central bank directly.
For his part, Mr. Powell doesn’t want to be seen as being politically motivated in his actions, which means that the 0.75 basis point is likely baked in. Certainly, with GDP growth at 2.6% in the most recent quarter, the Fed may feel it has room to raise rates further. Of course, there are some hints out there, such as steady job losses in technology, as well as recently announced layoffs in real estate (Compass, Zillow and, more recently, Coldwell Banker and Sotheby’s parent Anywhere), that some sectors of the economy may be in a recession. Recent reports suggest ongoing decreases in home sales, and housing starts. Meanwhile earnings for technology companies have plummeted. More recently, pending home sales recently crashed.
In addition, the Fed is likely aware that its tightening actions (higher interest rates and Qualitative Tightening – QT) have had an effect of the liquidity for both the stock market and the economy.
Obscure Data May be the Key
The Fed is known to use two obscure inflation measures, the PCE deflator (PCE) and the Employment Cost Index (ECI), as major influences on its decision. Both numbers recently registered figures which, at best, showed a potential flattening of inflation, but no overt decrease. This flattening could give the Fed some cover for a December pause, but not for a less-than-0.75 basis point cut in November.
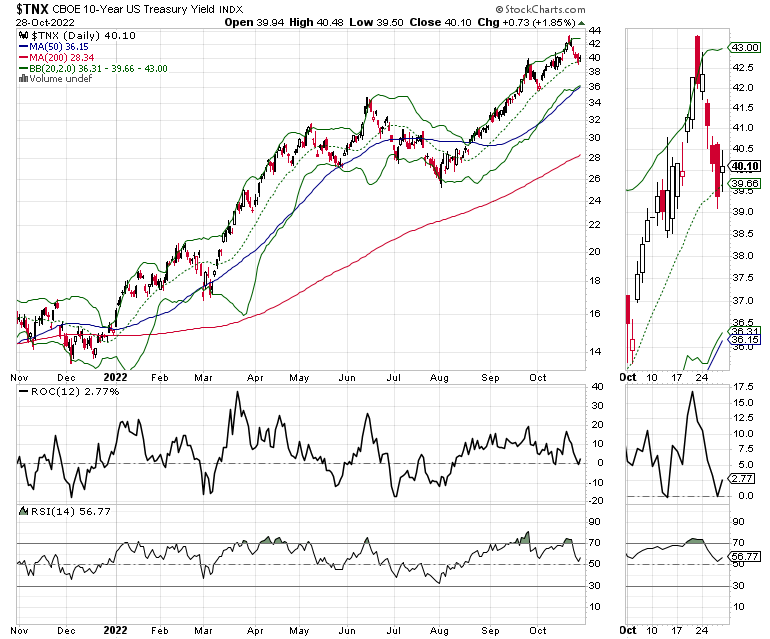
Bonds May Have Made a Meaningful Move
The U.S. Ten Year Note yield (TNX) fell last week, but ended above 4%. This suggests that bond traders recognize that some sectors of the economy are weakening while acknowledging that inflation, although it may have started to slow is still a problem.
A decisive break below 4% would be a bullish development for stocks. Note that the Bollinger Bands in this chart are set for two standard deviations above and below the 200 day moving average, which means that this chart is measuring a very meaningful set of technical parameters. Thus, the recent reversal after TNX rose above the upper band may be an important development.
What’s the Most Likely Outcome?
My bet is that the Fed will raise interest rates by 0.75 basis points, although there is a minuscule chance of a 1.00% rate increase. If the Fed raises by 1.0%, though, it would catch the market well off guard and likely create at least a short-term market crash, which would almost certainly spread to the economy.
I expect the Fed to avoid mention of its future actions or loosely suggest that its next move may be data dependent. More important, however, the next CPI release, which is scheduled for November 10, will likely influence the odds of a 0.75% increase in December.
Bottom Line
If the Fed is seen as abandoning its tough inflation fighter image and the CPI comes in stronger than expected, I expect the current market rally will run into a brick wall. The Fed’s statement after the November meeting and the subsequent CPI numbers are likely to be key data points. Meanwhile, the stock market could be entering a bullish seasonal period with all guns blazing — unless of course, the Fed, poor liquidity and the inflation data quelch the rally.
Welcome to the Edge of Chaos:
“The edge of chaos is a transition space between order and disorder that is hypothesized to exist within a wide variety of systems. This transition zone is a region of bounded instability that engenders a constant dynamic interplay between order and disorder.” – Complexity Labs
Old Tech Versus New Tech
The social media and big cap tech stocks got crushed last week on bad earnings misses. This has spawned a flurry of speculation about a transition away from technology stocks into stocks of companies whose products are more relevant for the times.
In this space, I’ve noted this general concept many times while focusing on the housing and energy sectors. Today, however, I’m going to compare old tech to new tech via two ETFs and what their price action may be suggesting.
First, let’s look at the Ark Innovation ETF, home to the so called tech of the future, with stocks such as EV kingpin Tesla (TSLA), cloud communications Twilio (TWLO), and crypto hub Coinbase (COIN). While these are not social media companies, they are considered bellwethers for the post-whatever buzzword that will describe the future technological landscape, with or without the Metaverse.
In the other corner, we have the Technology Select SPDR ETF (XLK), home to boring old money-printing machines such as Texas Instruments (TXN), Apple (AAPL) and Microsoft (MSFT). To be fair, all three of these tech mega-companies delivered bad earnings news recently. What’s worthy of noting is that XLK is recovering faster than ARKK. Neither of these ETFs are necessarily in bull markets, but money is definitely moving faster into old tech than into future tech.
The key lies in the Volume by Price bars (VBP) for both ETFs. While ARKK has to climb a mountain of very thick bars before becoming interesting, XLK is already tackling its less formidable wall of resistance. That suggests that money flows are abandoning the future and moving into the past. Check out my latest stock pick here.
NYAD Short-Term Looks Bullish. Liquidity Rally Rolls Over.
The market’s breadth has clearly bottomed. On the other hand, the recent bounce in liquidity may have stalled.
The New York State Advance Decline line (NYAD) has bullishly crossed above its 20-day moving average as the CBOE Volatility Index (VIX) has rolled over. That means money is moving into stocks and the number of put options being bought has been reduced. When VIX falls, stocks tend to rally.
A close look at NYAD shows that the recent low in the line was lower than its previous low, while the RSI failed to confirm the second low. That’s usually a very bullish sign, as it suggests that sellers finally capitulated.
On the other hand, the Eurodollar Index (XED) rolled over, which suggests liquidity may be drying up again. If that trend continues, it would signal an early end to the rally in stocks.
The S&P 500 (SPX) moved back above its 50-day moving average, with the 3900-4000 area becoming the new resistance band to watch. Accumulation Distribution (ADI) and On Balance Volume (OBV) are both moving sideways, which suggests that there are still people sitting this rally out.
The Nasdaq 100 index (NDX) remained above 11,000 with 11.500-12,000 still proving to be very credible resistance.
To get the latest up-to-date information on options trading, check out Options Trading for Dummies, now in its 4th Edition – Get Your Copy Now! Now also available in Audible audiobook format!
#1 New Release on Options Trading!
Good news! I’ve made my NYAD-Complexity – Chaos chart (featured on my YD5 videos) and a few other favorites public. You can find them here.
Joe Duarte
In The Money Options
Joe Duarte is a former money manager, an active trader and a widely recognized independent stock market analyst since 1987. He is author of eight investment books, including the best selling Trading Options for Dummies, rated a TOP Options Book for 2018 by Benzinga.com and now in its third edition, plus The Everything Investing in Your 20s and 30s Book and six other trading books.
The Everything Investing in Your 20s and 30s Book is available at Amazon and Barnes and Noble. It has also been recommended as a Washington Post Color of Money Book of the Month.
To receive Joe’s exclusive stock, option and ETF recommendations, in your mailbox every week visit https://joeduarteinthemoneyoptions.com/secure/order_email.asp.